The Environmental Impact of Dairy Farming: What the Data Actually Shows
Dairy’s environmental footprint tends to get discussed in extremes: either as a major driver of climate change, or as an industry unfairly singled out for criticism. Neither framing is much use if you’re the person accountable for a farm’s or a processor’s actual number. The figures below come from FAO’s own dairy sector assessments, not from either side of that argument.
The actual share
Milk production accounts for roughly 2.7% of global anthropogenic greenhouse gas emissions, according to the UN Food and Agriculture Organization. Include the meat from culled dairy animals and that figure rises to about 4%.
Agriculture as a whole contributes an estimated 14.5% of global anthropogenic emissions. Within livestock specifically, cattle, dairy and beef combined, account for more than 60% of global livestock emissions, with milk production representing roughly 30% of that livestock total (FAO, 2023).
These are real numbers, and nobody serious in the sector disputes them. But they’re smaller than a lot of public commentary implies, and the more useful question for anyone working on this isn’t the size of the number. It’s where it comes from.
Three sources, one dominant
A dairy system’s emissions break down into three categories:
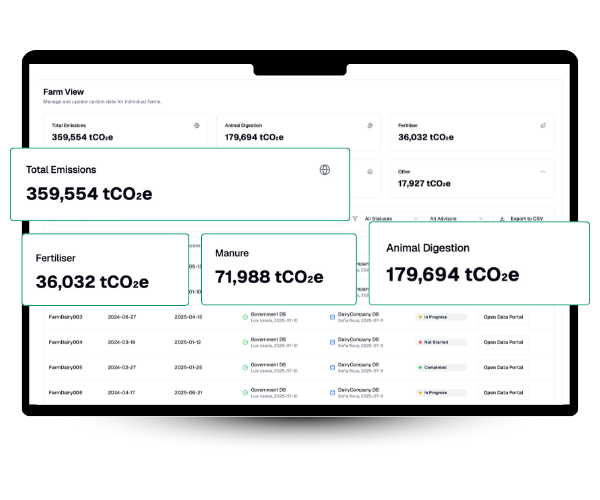
- Enteric methane, from digestion in the cow’s rumen, is consistently the largest single contributor: roughly 50 to 52% of milk’s total GHG impact, in both developed and developing dairy systems.
- Nitrous oxide, from manure and fertiliser nitrogen, accounts for around 27% of emissions in developed countries and closer to 38% in developing-country systems.
- Carbon dioxide, from energy, fuel, and inputs, makes up the smallest share, around 21% in developed countries.
Methane’s dominance is why so much mitigation work concentrates there: feed additives, breeding, enteric fermentation research. It’s not that the other two gases don’t matter. It’s that methane alone accounts for roughly half the total, so interventions there move the whole number more.
The efficiency gain most coverage skips
Global emissions intensity of milk has fallen by around 24% since 2000, the largest efficiency improvement recorded across any major agricultural commodity FAO tracks, cereals and eggs included. The current global average sits close to 1 kg CO2-equivalent per kilogram of milk produced, down from figures closer to 2.4 kg CO2-eq per kg in earlier FAO assessments.
That decline comes from two decades of compounding gains in feed efficiency, genetics, and herd management. It’s a real, measurable trend, and one that gets far less coverage than the raw emissions-share figures, mostly because “the sector is getting more efficient” doesn’t make for much of a headline. For a processor building its own sustainability case, this is worth stating plainly: the direction of travel is real progress, not just an aspiration.
Why one farm’s number won’t match another’s
Regional intensity varies far more than a single global average suggests. FAO’s dairy sector assessment shows average regional farm-gate emissions ranging from roughly 1.3 to 7.5 kg CO2-eq per kilogram of fat-and-protein-corrected milk, more than a five-fold spread, driven by feed quality, genetics, climate, and management.
A global or even national average is close to useless for planning a specific farm’s next step. What matters is that farm’s own baseline, built from its own primary data, not a regional estimate standing in for it. This is also why nitrogen use efficiency has become the metric several processors now treat as a proxy for data quality itself: it reflects what’s actually happening on a specific farm, not an industry average.
What this means for a mitigation plan
- Methane is where the interventions concentrate, and the data explains why. At roughly half of dairy’s footprint, feed strategy, genetics, and methane-inhibiting technologies deserve the weight they’re already getting.
- The 24% efficiency gain is a legitimate number to use publicly, provided it’s paired with a forward plan rather than treated as a finishing line.
- Farm-level primary data, not benchmarks, should drive planning. The five-fold regional spread makes clear that a national average tells you almost nothing about where your own farm’s next reduction sits.
- Budget should follow the emissions split. A plan spread evenly across methane, nitrous oxide, and carbon dioxide is ignoring that one of those three carries half the total impact on its own.
Dairy’s footprint is real and it’s shrinking per unit of milk produced. The more useful conversation in this sector isn’t whether dairy has an impact. It’s which specific, evidence-based intervention moves a given farm’s number, for that farm’s herd, region, and system.
Sources: FAO, Greenhouse Gas Emissions from the Dairy Sector: A Life Cycle Assessment; FAOSTAT Analytical Brief Series, Greenhouse gas emissions from agrifood systems (2022); FAO livestock sector emissions data (2023).