ODOS Tech — Bring Your Data Together — Hero Preview
One View Of Your Supply Chain

Bring Your
Data Together

Bring every livestock farm's data into one place. Upload what you have, connect your existing tools, and build a foundation you can act from.

All Your Farm Data In One View 4 sources → 1 dashboard
Pull key data from every scattered source into one standard view
Spreadsheets Cool Farm Tool ERPs & APIs Satellite ODOS Tech Unified data layer Overview Emissions details Farm breakdown Performance Practices Footprint 0.79 Farms 210 Footprint by farm
ODOS Tech — How Data Gets In
How data gets in

Send Us Your Data,
We'll Take It From There

Every dairy supply chain starts in a different place. Pick the one that sounds like you, and we'll show you exactly how your data gets in.

Which one are you?

Pick a scenario above, we'll walk through exactly how your data gets in, and what makes it possible.

Farm Visit Assessment Guided, on-site, ready the same day Herd records Done Feed & ration Done Manure & slurry In progress Energy use Not started Pre-filled from what you already track, finished on-site

We help you find the rest, with a guided visit that fills in what a spreadsheet never could.

How it works

1

Share what you already track: milk volumes, herd records, whatever exists.

2

We pre-fill the assessment from that data.

3

A guided farm visit fills in the gaps: feed, manure, fertiliser, energy.

Herd_Feed_2026.xlsx 247 rows · uploaded 2 min ago Uploaded file ODOS Tech Unified data layer Overview Emissions details Farm breakdown Performance Practices Footprint 0.79 Farms 210 Footprint by farm

We do the work without visiting a farm, turning what you already track into an auditable assessment.

How it works

1

Upload your primary data: herd, feed, manure, fertiliser records.

2

We clean it, structure it, and apply industry-trusted emission factors.

3

You get an auditable assessment, ready to report from.

Cool Farm Tool ERPs & APIs National databases Agronomist data ODOS Tech Unified data layer Overview Emissions details Farm breakdown Performance Practices Footprint 0.79 Farms 210 Footprint by farm

We connect to what you already run, so nothing gets entered twice.

How it works

1

Connect what you already run: Cool Farm Tool, agronomist platforms, ERPs, national databases.

2

We map and reconcile it, no second round of data collection.

3

One account, one number, one place to act.

ODOS Tech — What The Data Becomes

01 · Standardise

One Clean, Standardised Dataset

Every input, however it arrived, lands in the same format. Validated, structured, and ready to use across your whole supply chain.

  • Every farm on one common data standard
  • Gaps filled with proven emission factors
  • Ready for reporting, audit, or analysis
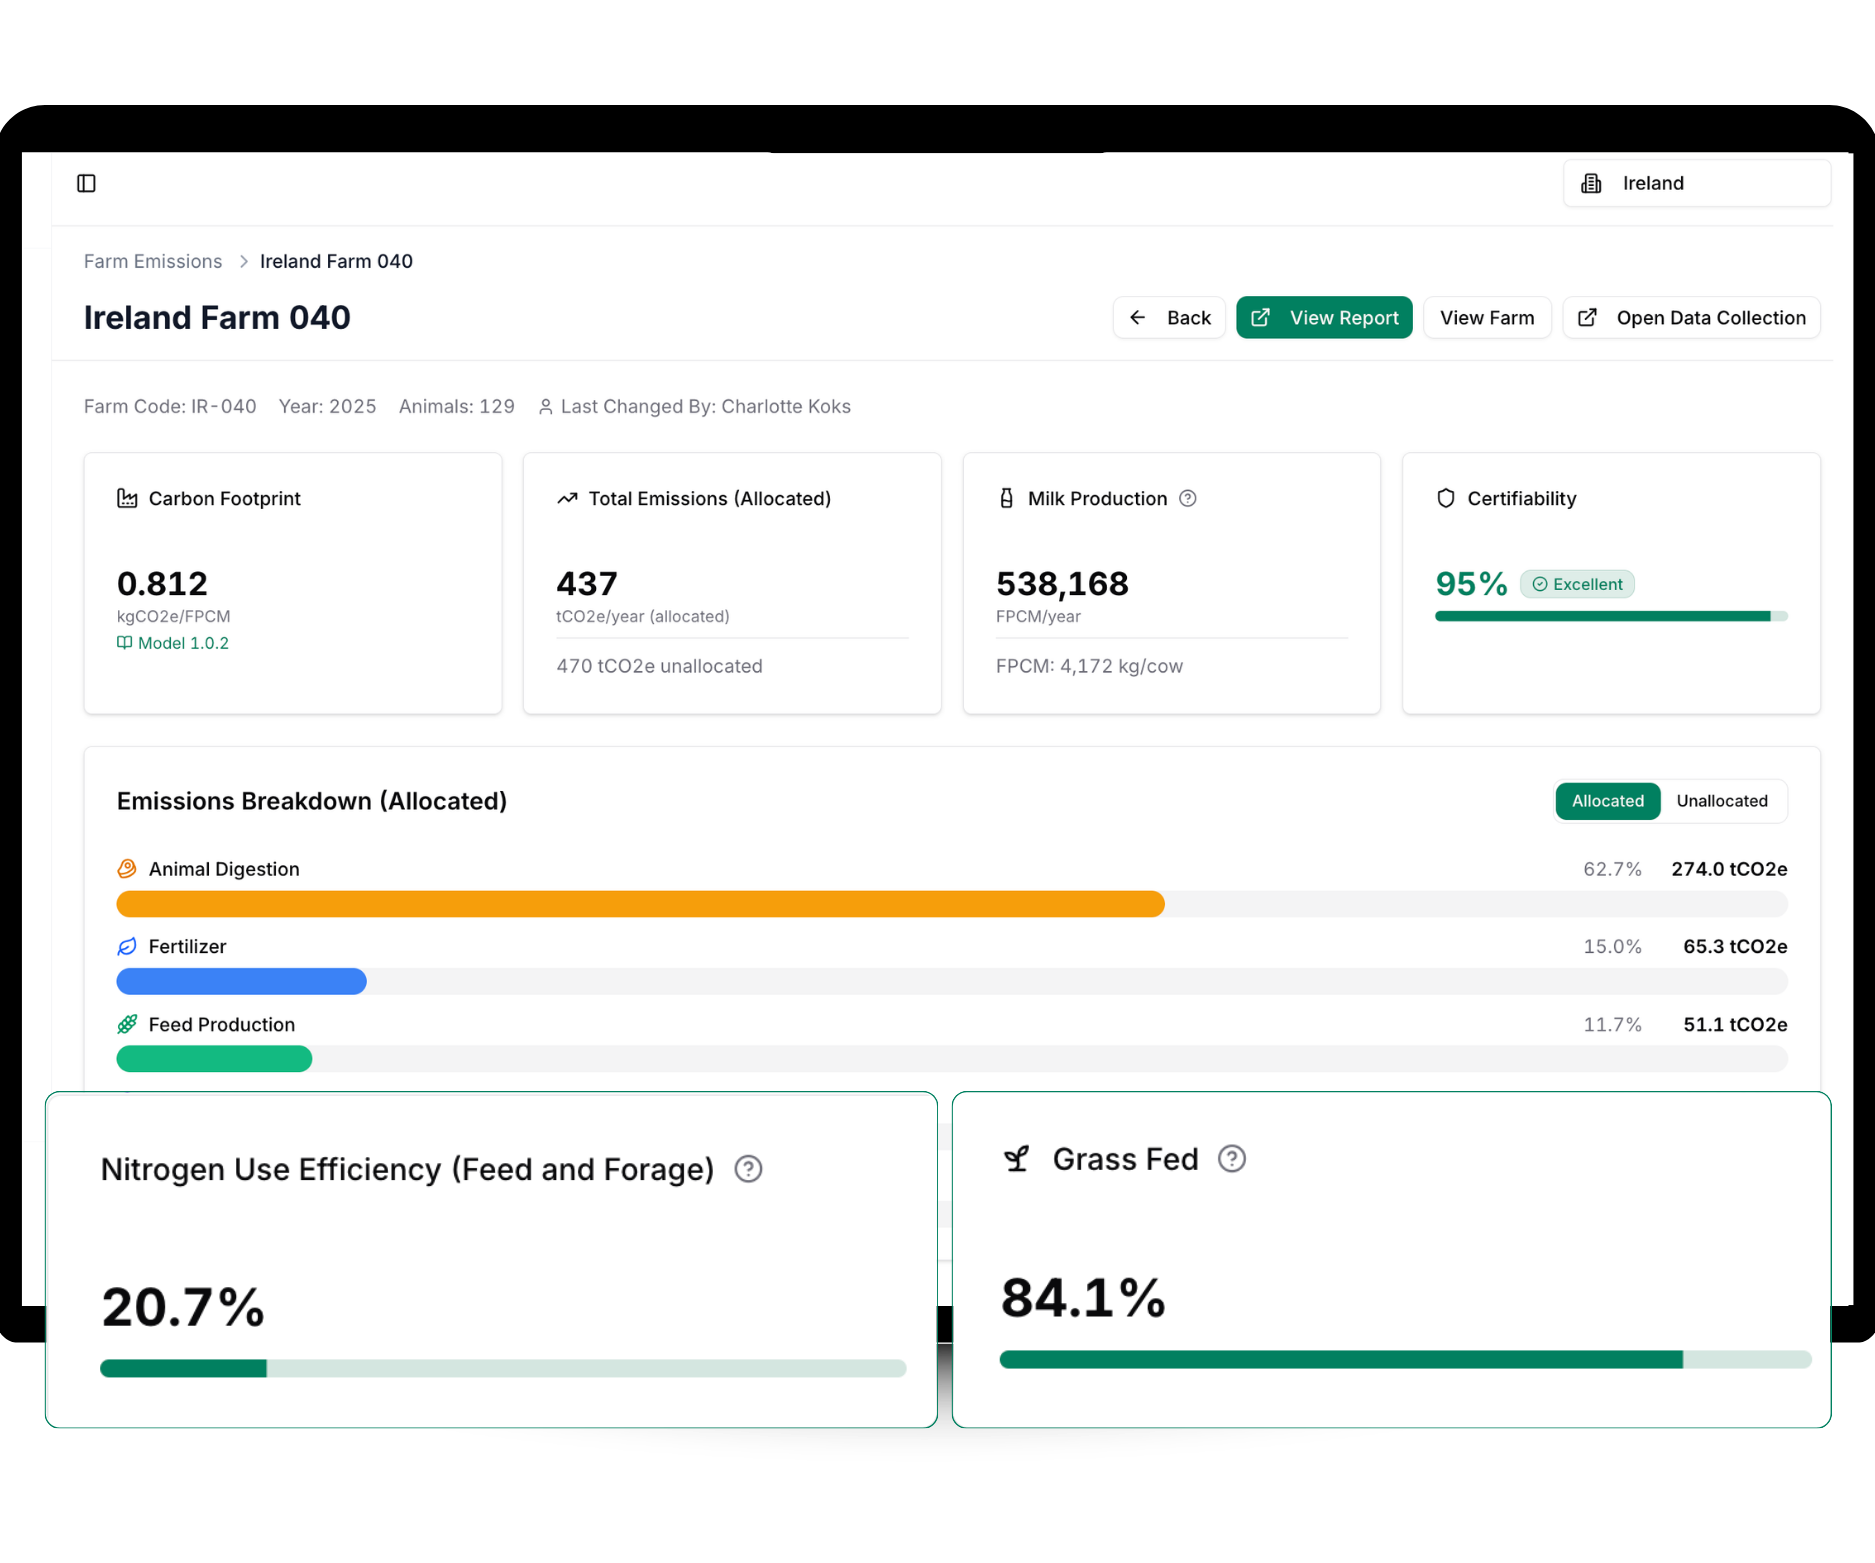
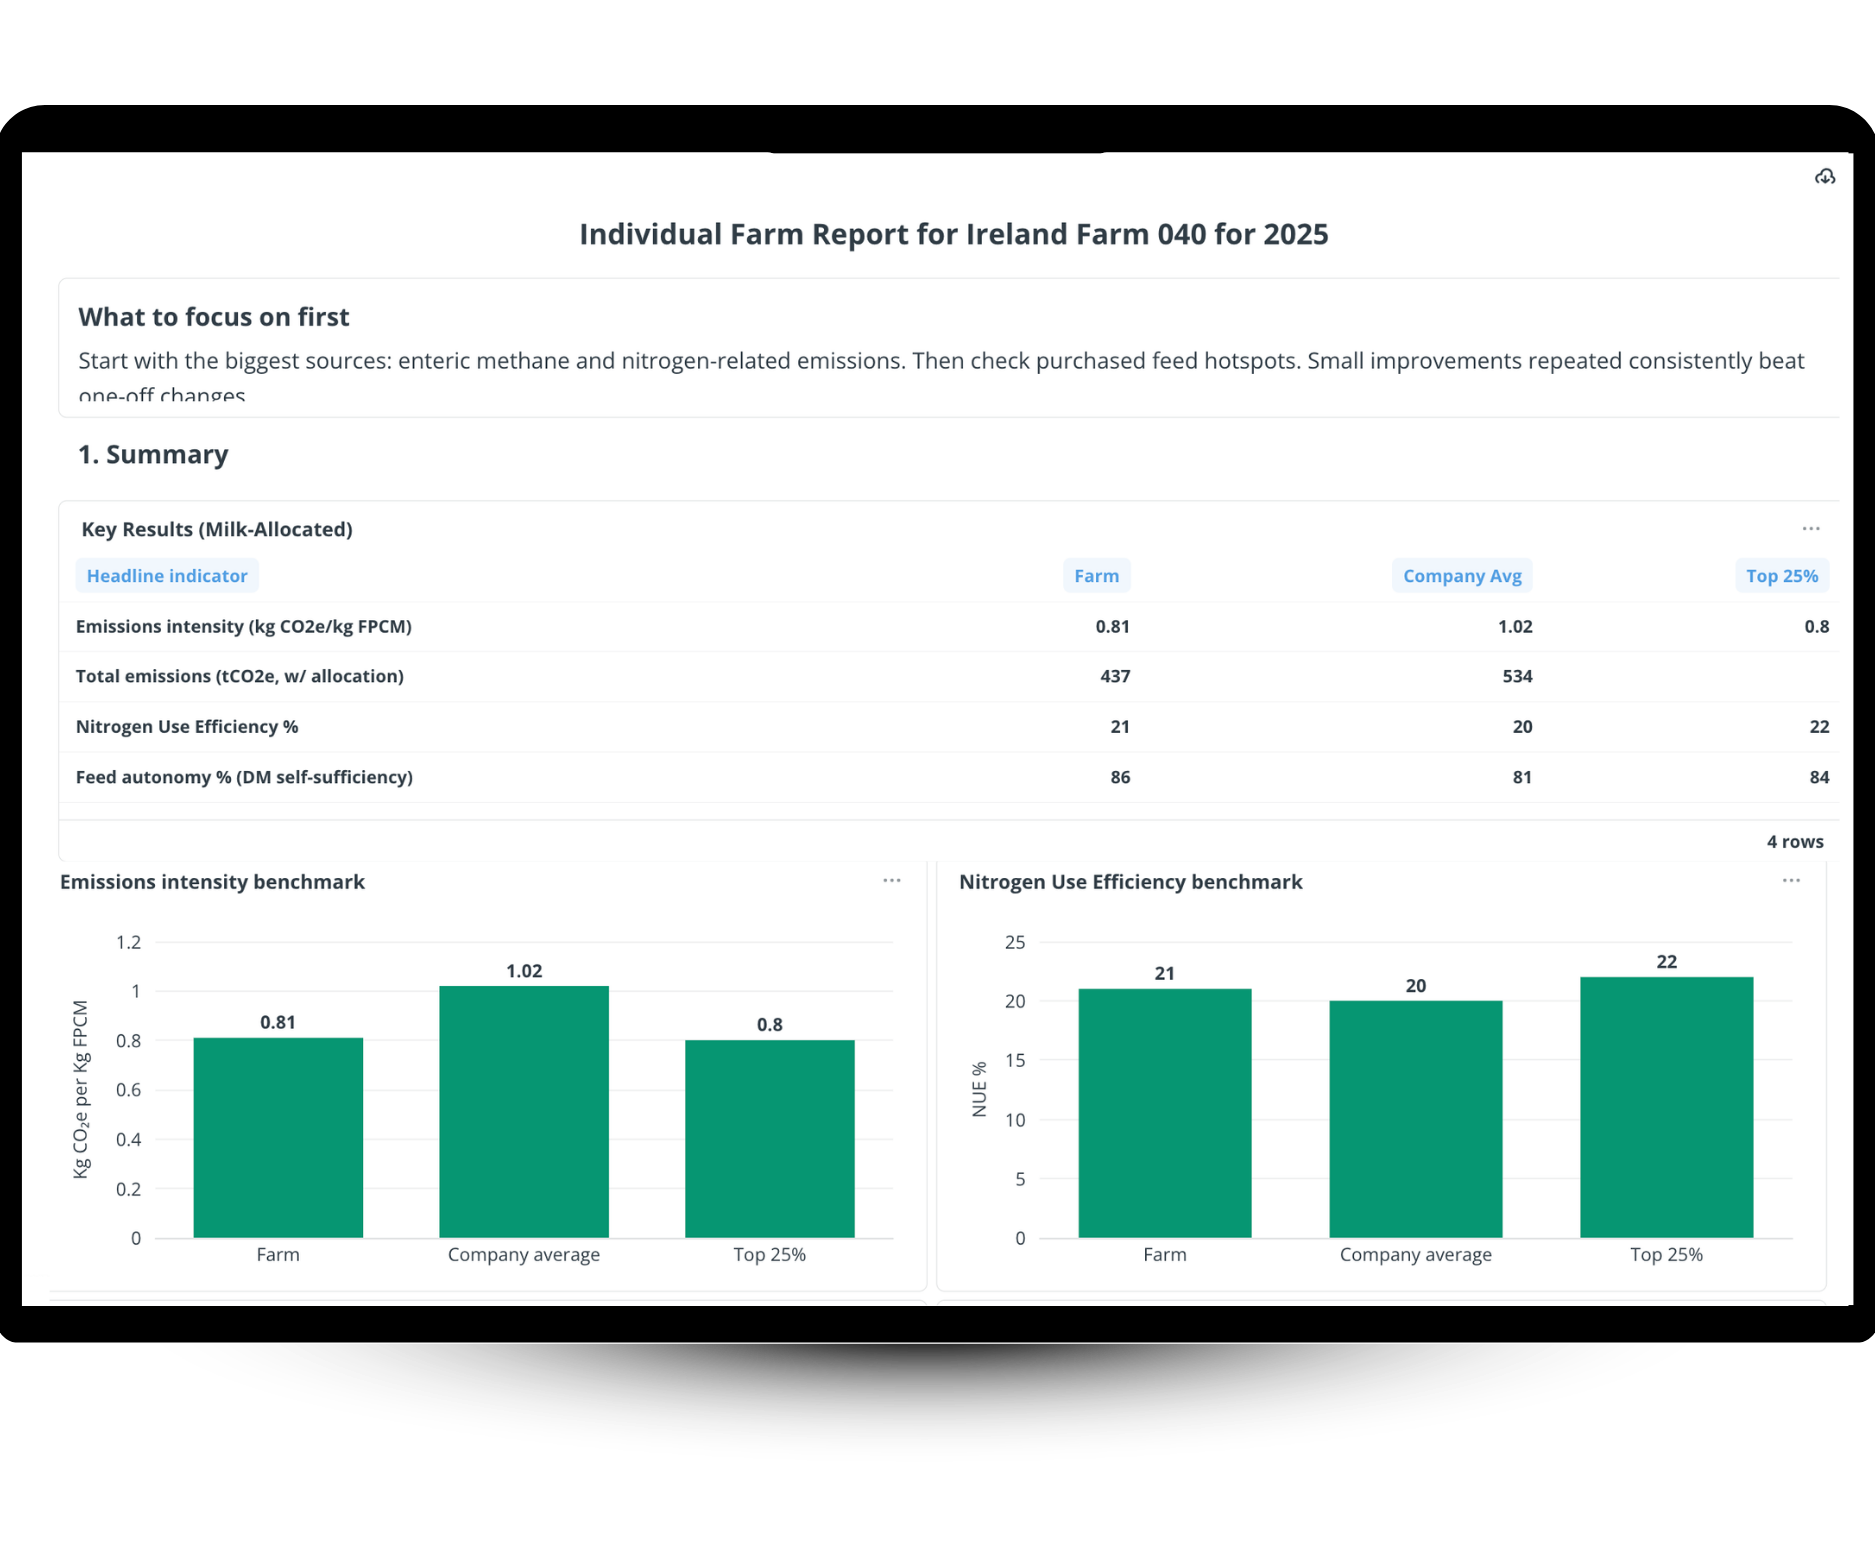
Standardised farm data mockup
Custom report builder mockup

02 · Report

Reports Built Your Way

Drag, drop, and download. Choose what to include, top emitters, best performers, or your full supply chain, and export it straight from the platform.

  • Custom reports for any audience
  • Top emitters, best performers, full chain
  • Exportable, audit-ready, in minutes

03 · Map

Every Farm's Land Mapped

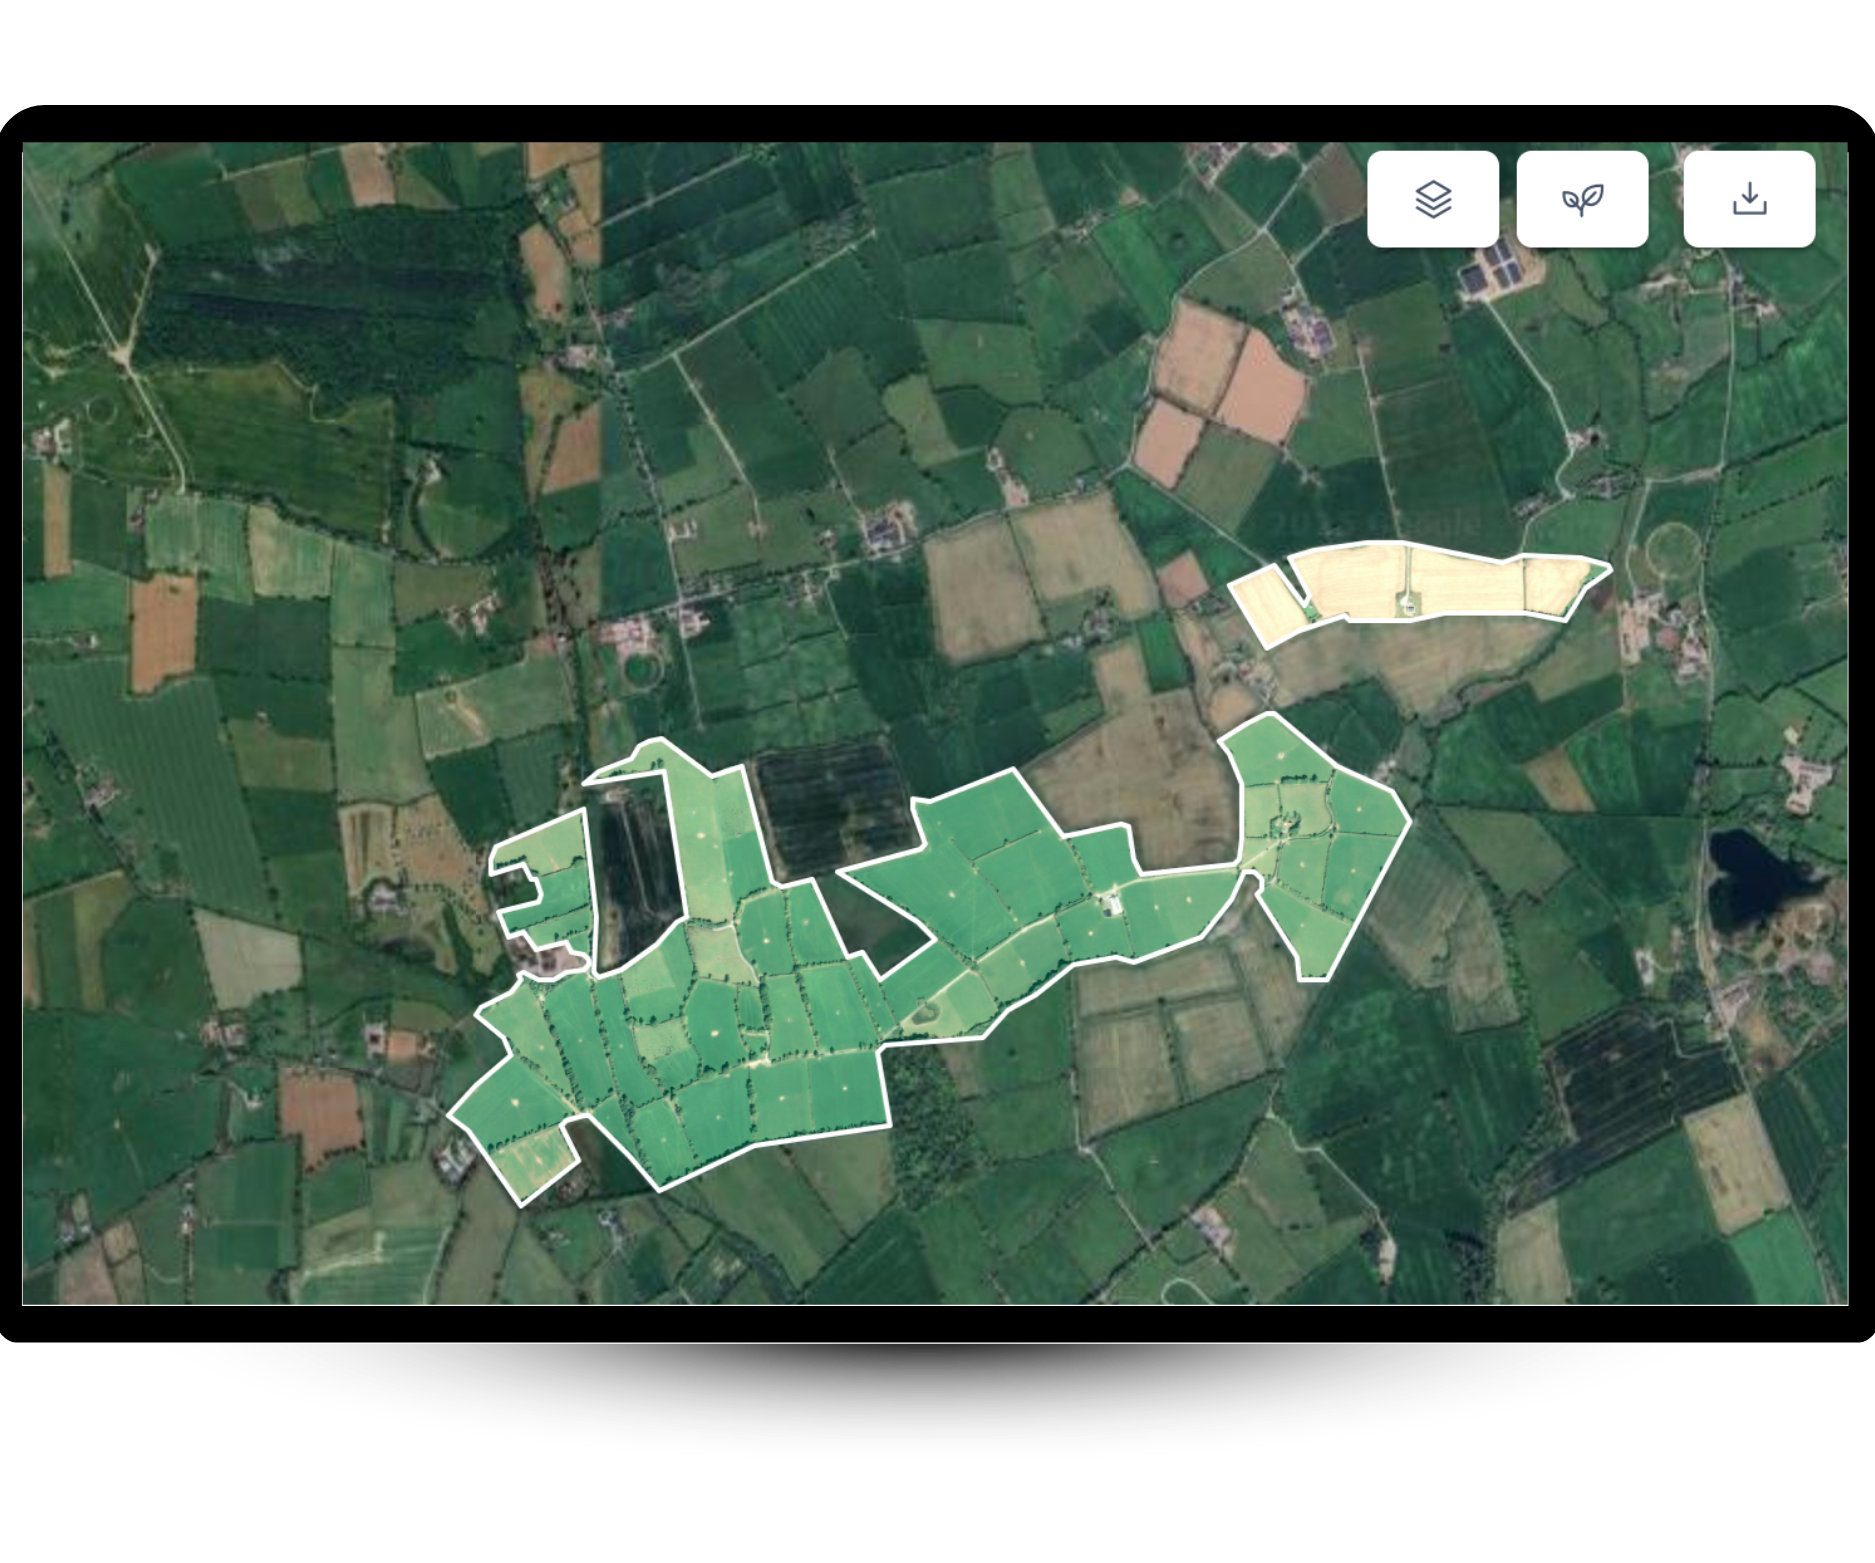
The same farms, mapped from satellite. Every parcel extracted and scored for Space for Nature, ready to feed into your biodiversity baseline.

  • Farm boundaries extracted from satellite
  • Every parcel scored for Space for Nature
  • Feeds directly into your biodiversity baseline
See how we extract farm boundariesSee it in action
Farm boundary mapping mockup
Next: Analyse Your Supply Chain

Your Data Is Ready.
Now See What It's Telling You.

Your data is together, clean, and structured. The next step is turning it into insight. See your full supply chain as a set of interactive dashboards, spot patterns, compare farms, and find where efficiency and emissions improve together. Your data is ready. Now turn it into insight: spot patterns, compare farms, and find where efficiency and emissions improve together.

Spot the Patterns

See your footprint at a glance, farm by farm and across the whole supply chain. Drill in where it matters, and understand what's actually driving your numbers. See your footprint at a glance, farm by farm.

Compare Every Farm

Benchmark footprint against productivity, feed efficiency, and nitrogen use. Spot the highest emitters, the best performers, and the farms with the biggest room to improve. Benchmark farms on footprint, productivity, and efficiency.

Find Where Action Pays Off

Feed blends, fertiliser rates, slurry storage and spreading. See where efficiency and emissions move together, so you know exactly where to act next. See exactly where efficiency and emissions improve together.

From data to insight.

See how ODOS Tech turns your supply chain into dashboards you can act on.

Analyse your supply chain See it in action

Turn Your Data Into Action

We’ll show you a credible net zero pathway, the interventions that move your supply chain’s footprint most, and how every action your farmers take can be accounted for, using your data.