How to Choose The Right LCA Software for Food Supply Chains

Quick answer: A true life cycle assessment (LCA) tool is not the same thing as a carbon footprint calculator. LCA follows a defined methodology, set out in ISO 14040/44, that covers multiple environmental impact categories, not just carbon, across clearly stated system boundaries. When choosing LCA software for a food or livestock supply chain, the deciding factors are methodological rigour, sector-specific alignment (FAO LEAP, IDF), and data quality, not just whether it produces a number.
Carbon Footprint Tool or LCA Software? They're Not the Same Thing
Most companies use “carbon footprint” and “LCA” interchangeably. In practice, they answer different questions.
A carbon footprint calculation, typically following the GHG Protocol or PAS 2050, measures a single impact category: greenhouse gas emissions. It’s fast, familiar, and usually sufficient for Scope 1–3 reporting.
A full LCA, as defined by ISO 14040 and 14044, is broader. It follows four required phases, goal and scope definition, life cycle inventory, life cycle impact assessment, and interpretation, and it can cover multiple environmental impact categories at once: climate change, land use, water use, eutrophication, acidification, and others, depending on the standard applied. The EU’s Product Environmental Footprint (PEF) method, for example, defines around 16 such categories.
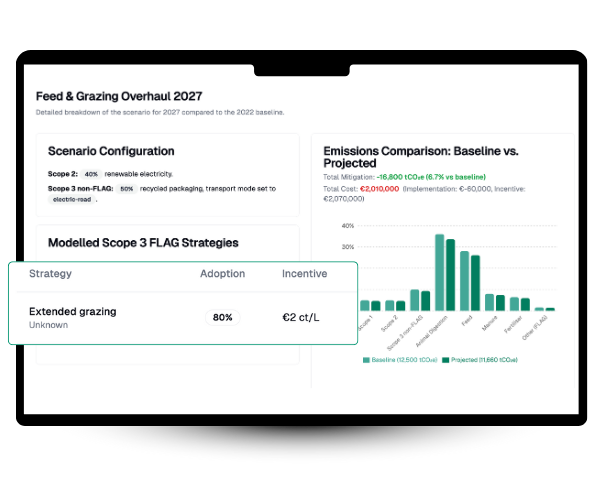
If your reporting only needs a defensible carbon number, a carbon accounting platform may be all you need. If you need to understand trade-offs, does reducing methane increase land use elsewhere, does a feed change reduce carbon but raise water demand, you need software built on true LCA methodology, not a single-issue carbon tool relabelled as one.
What Actually Differs in LCA Software for Food and Livestock
We won’t repeat the data-quality, CSRD-alignment, and system-integration criteria we covered in our carbon accounting guide, they apply here too. What’s specific to evaluating LCA software is methodological.
1. Defined system boundaries, stated explicitly
Every LCA needs a stated boundary: cradle-to-farm-gate, cradle-to-processing-gate, or full cradle-to-grave. Just as importantly, check whether the tool applies an attributional approach (average impacts of current production) or a consequential one (the impact of a marginal change, such as increasing output by 10%). These produce different numbers for the same farm, and comparing results across the two without knowing which was used is a common, avoidable error.
2. A functional unit that matches your product and sector
LCA results must be normalised to a functional unit, not reported as raw farm totals. For dairy, the sector-standard approach (from the International Dairy Federation’s carbon footprint methodology) uses Fat-and-Protein-Corrected Milk (FPCM) rather than raw litres, since milk composition varies by breed and season. For red meat, functional units are typically expressed per kilogram of carcass weight or liveweight. Software that reports only farm-level totals, without normalising to the right functional unit for your product, makes cross-farm and cross-year comparison unreliable.
3. Sector-specific methodology, not a generic industrial LCA
Generic LCA software is often built around industrial and manufacturing datasets. Livestock systems have their own established guidance: the FAO’s Livestock Environmental Assessment and Performance (LEAP) Partnership publishes sector-specific LCA guidelines for dairy, red meat, poultry, and feed, developed specifically to handle the biological variability that industrial LCA methods weren’t designed for. A platform aligned with FAO LEAP and IDF guidance will produce results that hold up to sector scrutiny; one built on generic industrial defaults may not.
4. Transparent data quality, not just “farm data used”
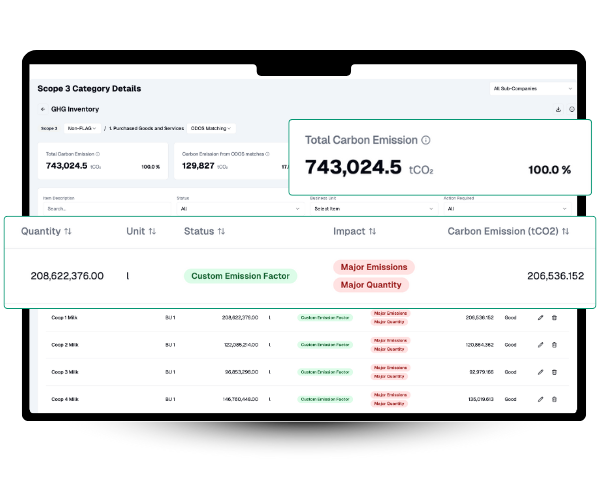
ISO 14044 requires LCA practitioners to assess data quality, not just note whether it’s primary or secondary. This is typically judged using a pedigree matrix: scoring inputs on reliability, completeness, temporal correlation (how recent), geographic correlation (how local), and technological correlation (how representative of your actual practices). Good LCA software should expose this, so you can see not just what number was produced, but how much confidence to place in it, and where the weakest data sits.
5. Interpretation and hotspot analysis, not just a final figure
ISO 14044’s fourth phase, interpretation, is often skipped by simpler tools. A proper LCA output should identify which lifecycle stage drives the impact, in most livestock systems, feed production is consistently one of the largest single contributors, so a platform should surface that automatically, not leave you to work it out from a spreadsheet of intermediate values.
A Real Example: What "Beyond Measurement" Looks Like
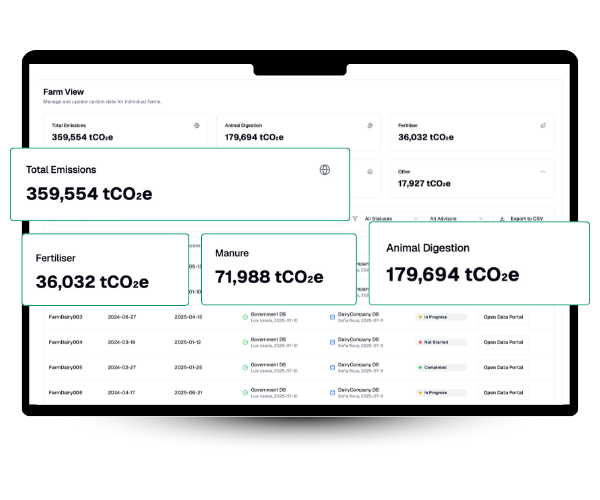
Spanish dairy cooperative COVAP needed to move away from spreadsheet-based, farm-by-farm calculations that varied in assumptions and boundaries depending on who built them. Working with ODOS Tech, COVAP applied a single, consistent methodology across more than 280 farms, standardising system boundaries, functional units, and data quality checks across the entire cooperative.
The result wasn’t just more data. It was data that could actually be compared, farm to farm, and year to year, because every result had been built on the same methodological foundation rather than 280 slightly different ones.
How ODOS Tech Approaches This
- Sector-specific methodology, built around livestock production systems rather than adapted from generic industrial LCA
- Explicit, consistent system boundaries and functional units applied uniformly across every farm in a supply chain, so results are genuinely comparable
- Farm-level primary data wherever possible, reducing reliance on generic secondary datasets and improving the confidence of results
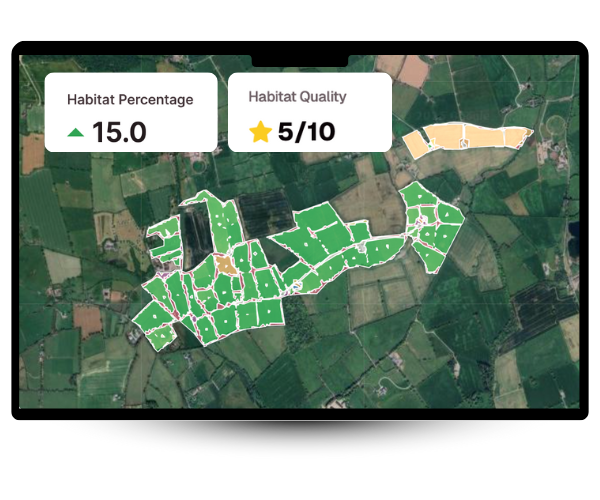
- Biodiversity and land-use impact measured alongside carbon, using satellite imagery and AI, one of the impact categories that generic carbon-only tools don’t cover at all
- Traceable assumptions and emission factors, so results can be interpreted and defended, not just reported
A carbon number tells you where you stand. A proper LCA tells you why, and what happens if you change something. For food and livestock supply chains facing CSRD, retailer scorecards, and increasingly sophisticated buyer questions, that distinction is becoming the difference between a report that satisfies a checkbox and one that actually holds up.