
01 · Standardise
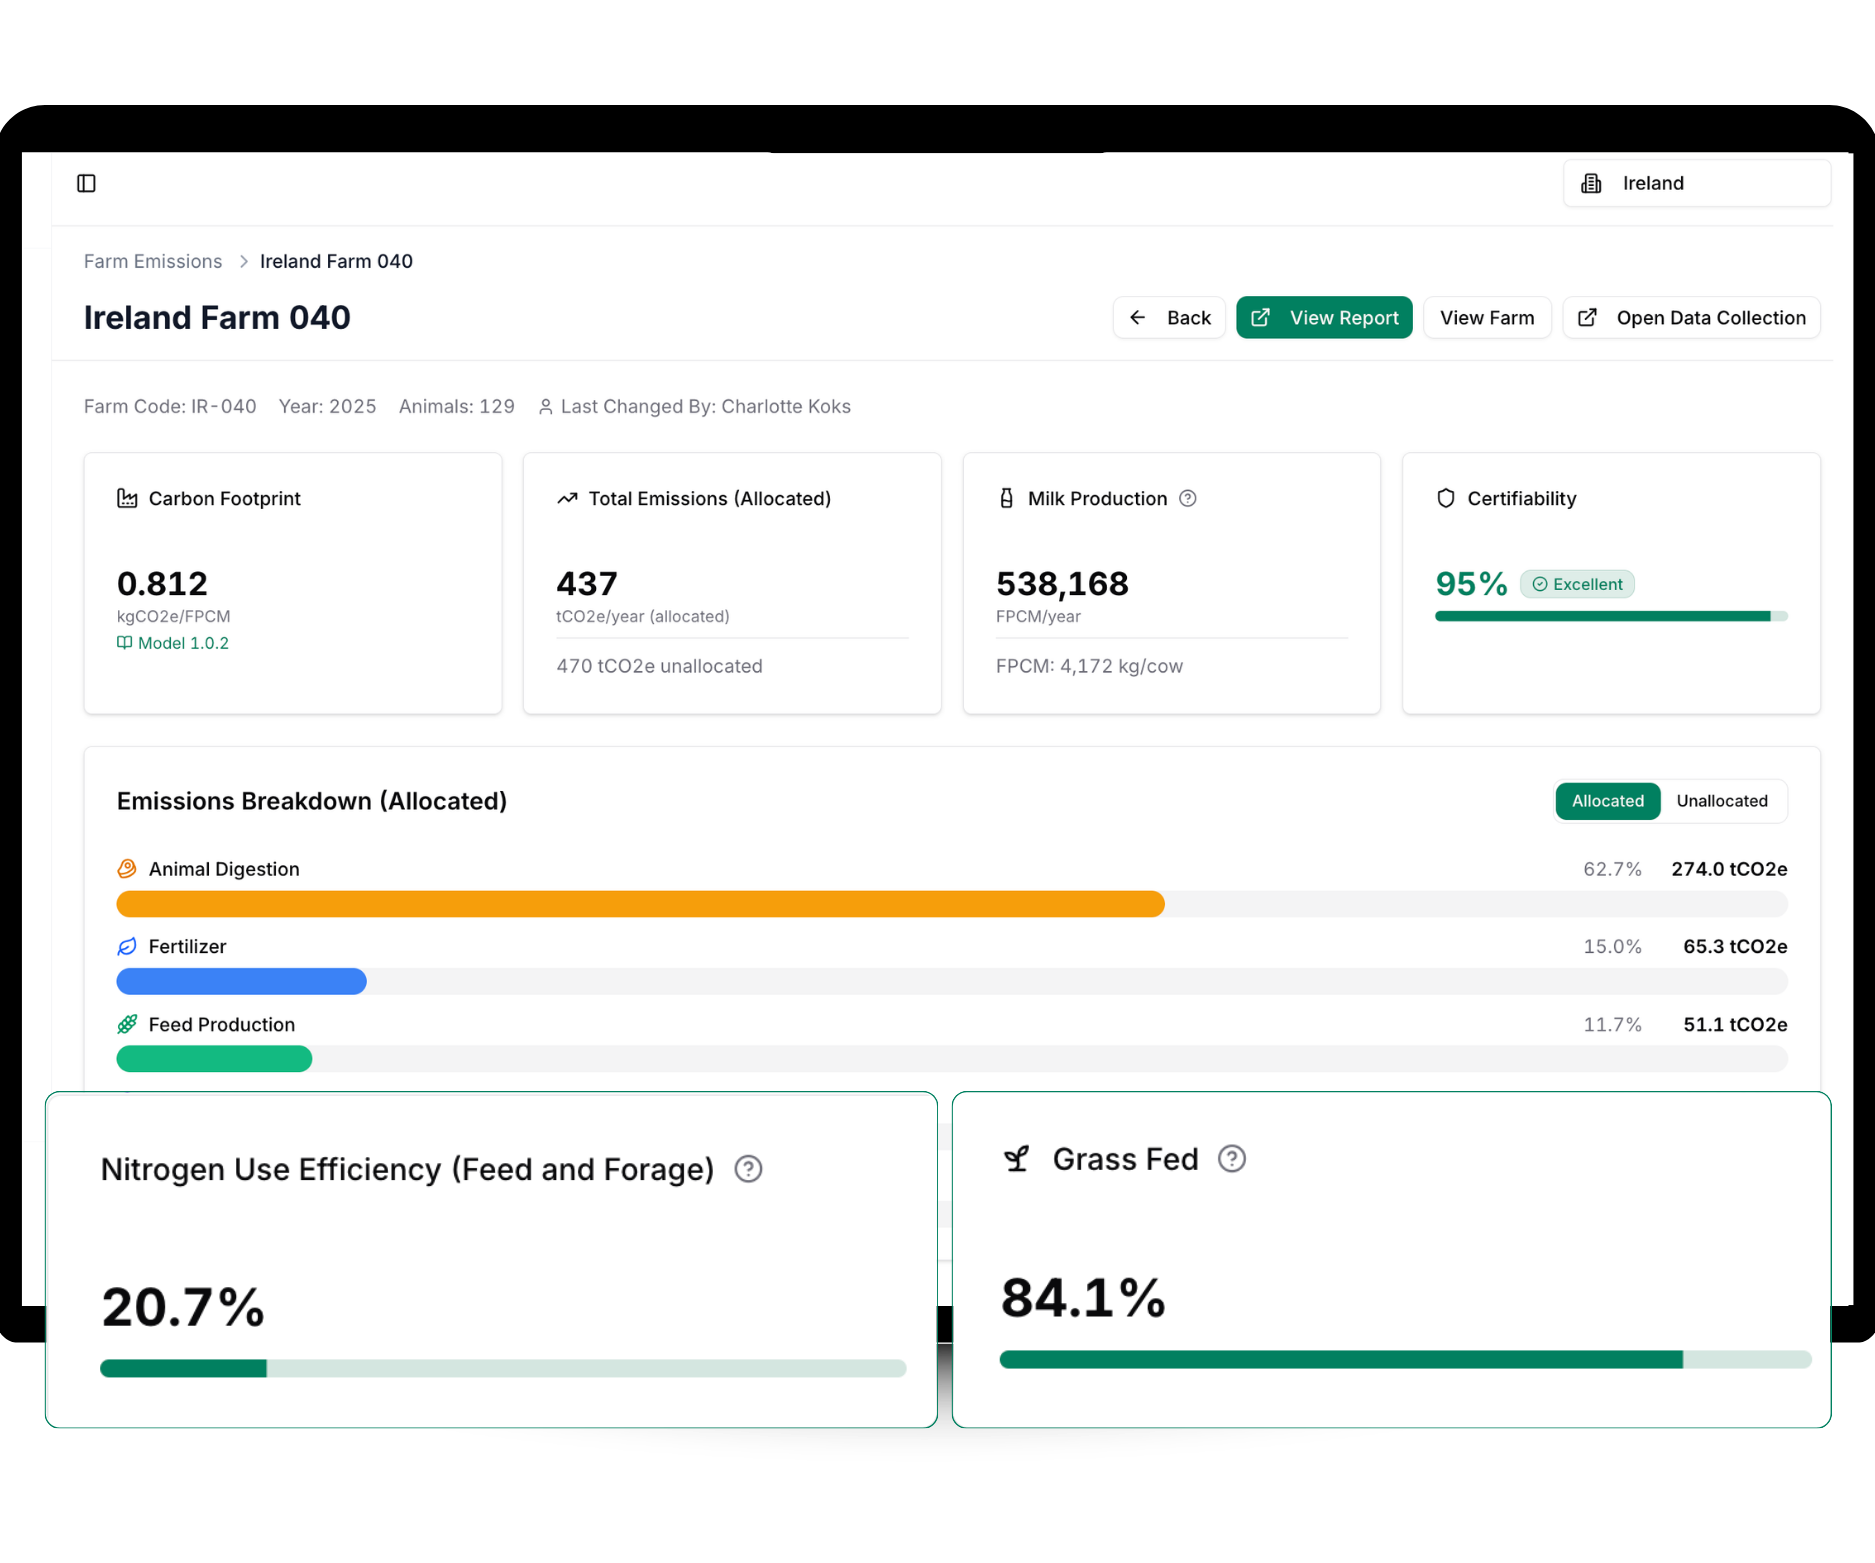
One Clean, Standardised Dataset
Every input, however it arrived, lands in the same format. Validated, structured, and ready to use across your whole supply chain.
- Every farm on one common data standard
- Gaps filled with proven emission factors
- Ready for reporting, audit, or analysis
02 · Report
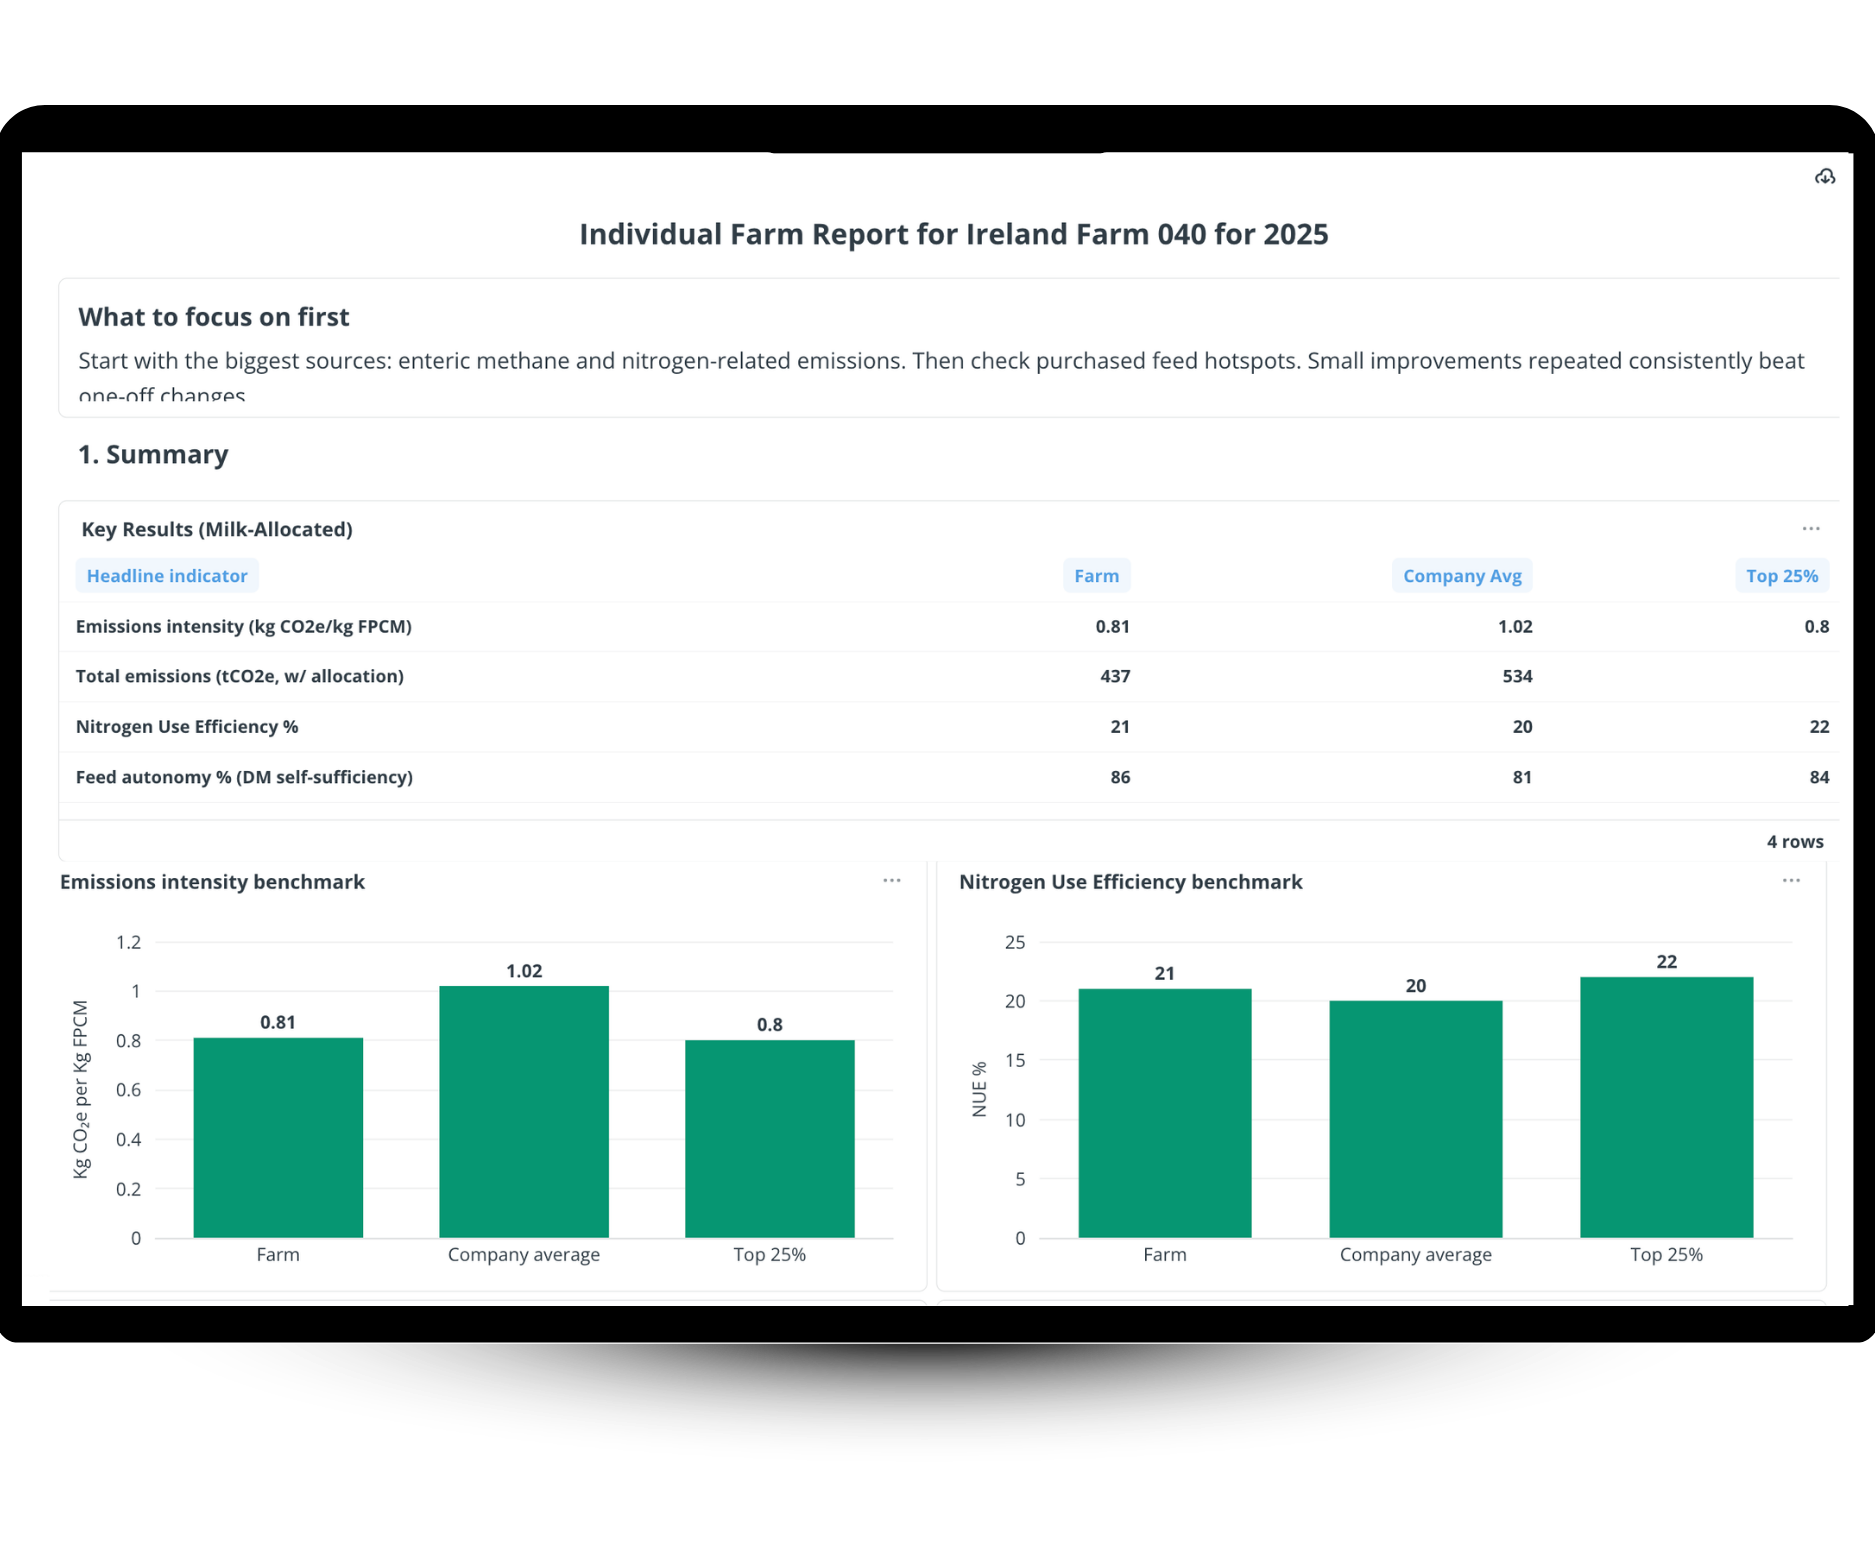
Reports Built Your Way
Drag, drop, and download. Choose what to include, top emitters, best performers, or your full supply chain, and export it straight from the platform.
- Custom reports for any audience
- Top emitters, best performers, full chain
- Exportable, audit-ready, in minutes
03 · Map
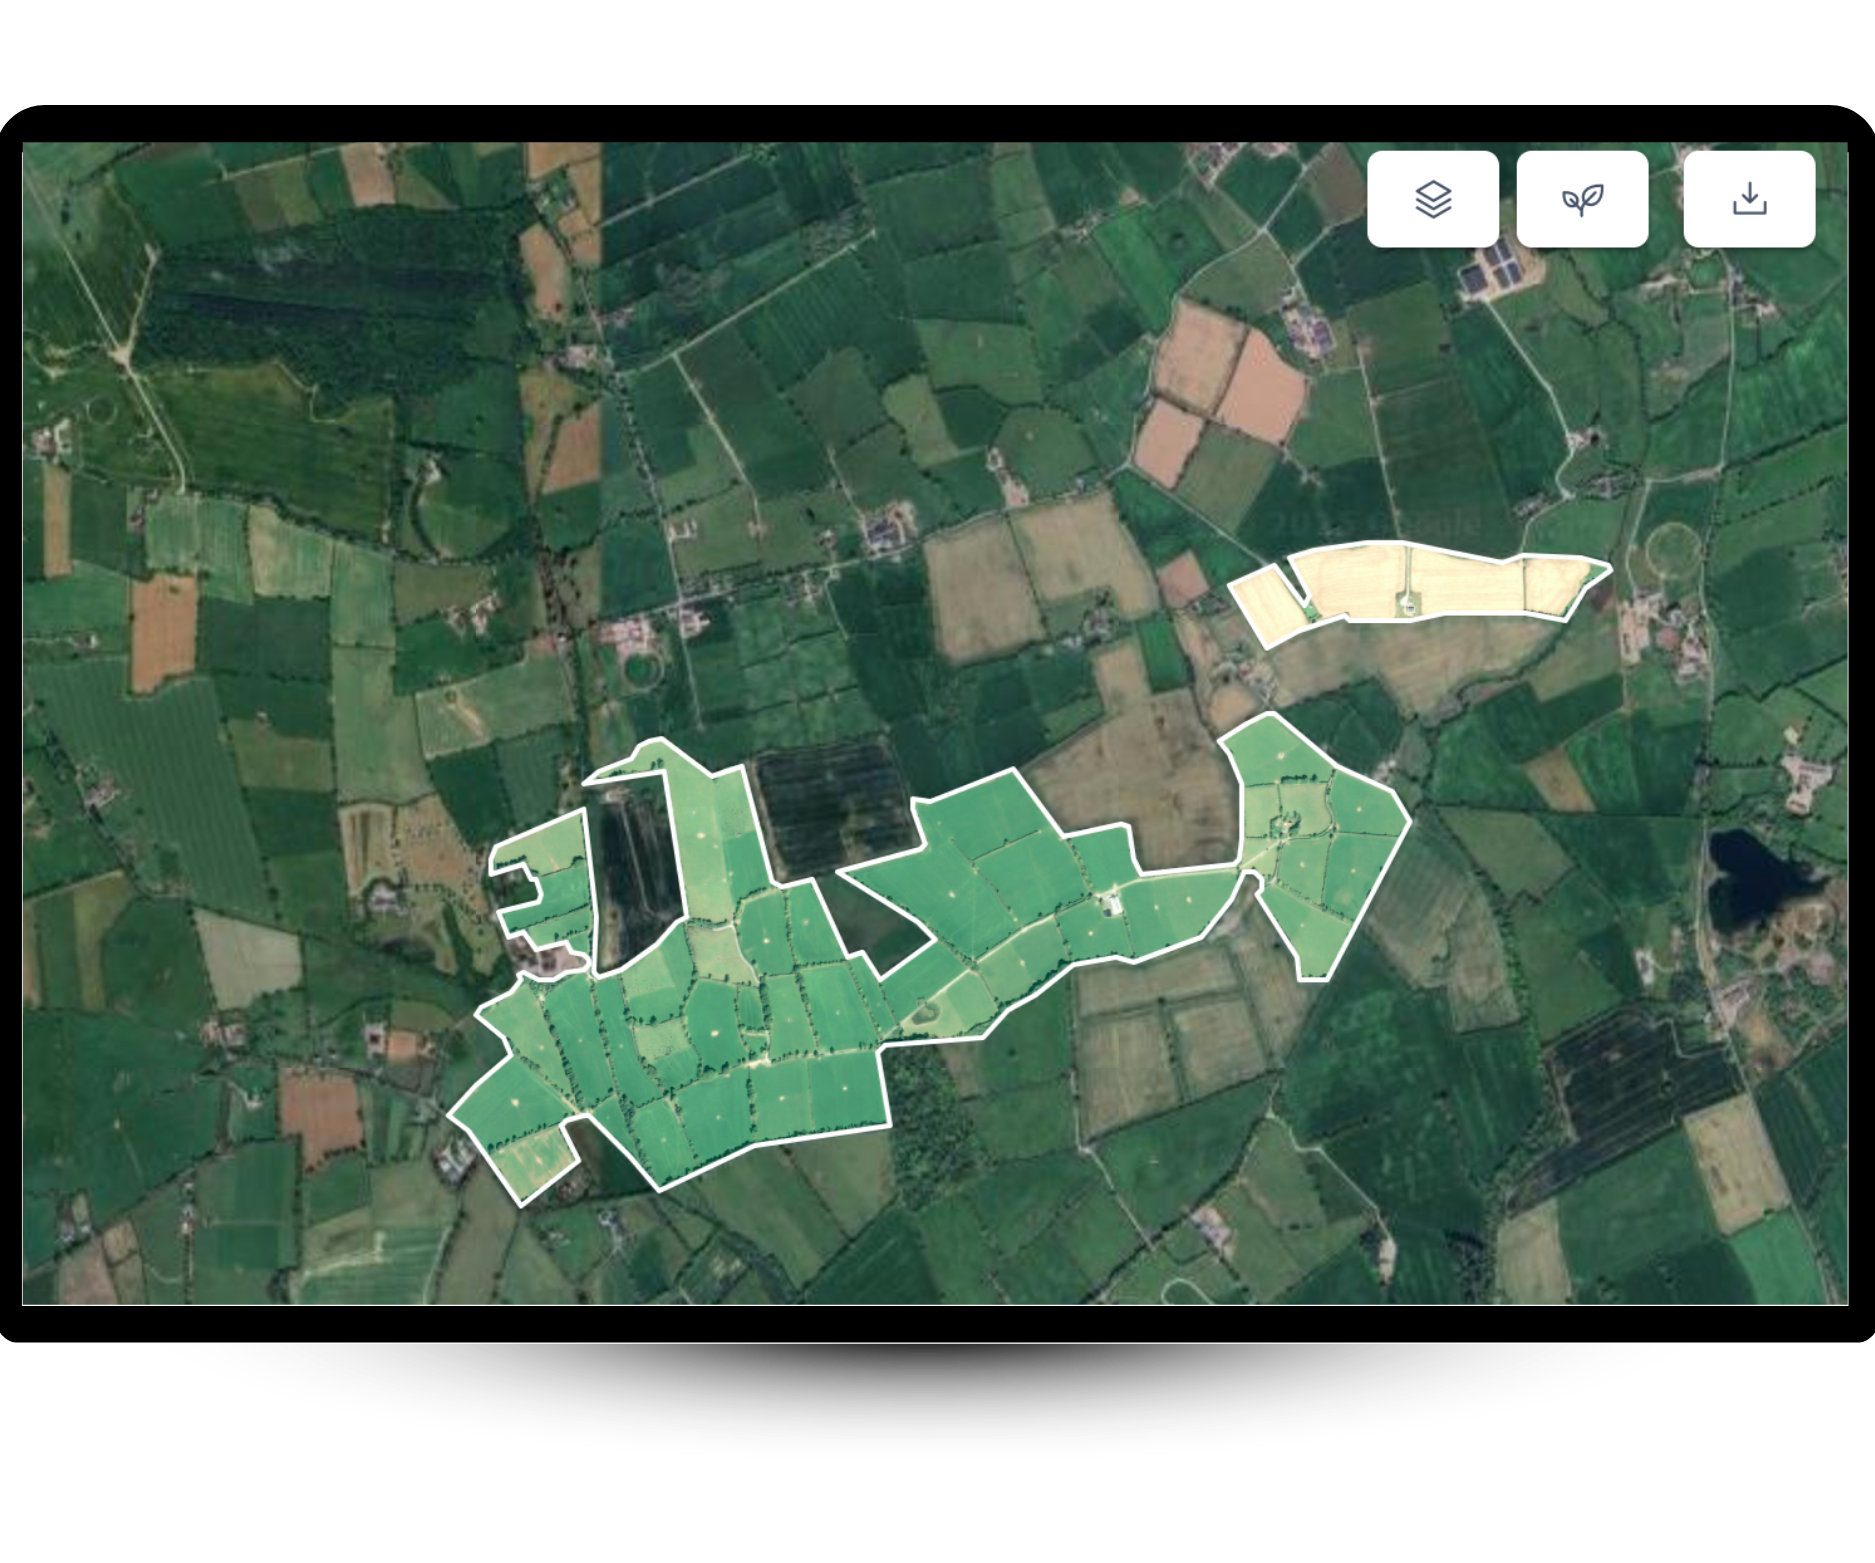
Every Farm's Land Mapped
The same farms, mapped from satellite. Every parcel extracted and scored for Space for Nature, ready to feed into your biodiversity baseline.
- Farm boundaries extracted from satellite
- Every parcel scored for Space for Nature
- Feeds directly into your biodiversity baseline
Your Data Is Ready.
Now See What It's Telling You.
Your data is together, clean, and structured. The next step is turning it into insight. See your full supply chain as a set of interactive dashboards, spot patterns, compare farms, and find where efficiency and emissions improve together. Your data is ready. Now turn it into insight: spot patterns, compare farms, and find where efficiency and emissions improve together.
Spot the Patterns
See your footprint at a glance, farm by farm and across the whole supply chain. Drill in where it matters, and understand what's actually driving your numbers. See your footprint at a glance, farm by farm.
Compare Every Farm
Benchmark footprint against productivity, feed efficiency, and nitrogen use. Spot the highest emitters, the best performers, and the farms with the biggest room to improve. Benchmark farms on footprint, productivity, and efficiency.
Find Where Action Pays Off
Feed blends, fertiliser rates, slurry storage and spreading. See where efficiency and emissions move together, so you know exactly where to act next. See exactly where efficiency and emissions improve together.
From data to insight.
See how ODOS Tech turns your supply chain into dashboards you can act on.