-
Habitat Quanitity
Measuring Biodiversity Through
Space for Nature
Meet the EU 2030 target of 10% agricultural land under natural or semi-natural habitats. Learn how ODOS measures habitat quantity across your supply chain with AI and satellite data.
Measuring Biodiversity Through Space for Nature
Meet the EU 2030 target of 10% agricultural land under natural or semi-natural habitats. Learn how ODOS measures habitat quantity across your supply chain with AI and satellite data.
Understanding Space for Nature
Discover the role of habitat in sustainable farming.
What Is Space for Nature?
Space for Nature refers to the share of farmland set aside for natural or semi-natural habitats, like hedgerows, woodlands, ponds, and grasslands. These areas support pollinators, protect soil and water, and create corridors for wildlife.
-
Share of farmland set aside for natural habitats.
-
Supports biodiversity and ecosystem health.
-
EU demands 10% of farmland dedicated to space for nature.
Understanding Land Cover Types
Not all agricultural land contributes equally to biodiversity. Space for Nature distinguishes between managed productive areas and natural habitats that support wildlife. Features like hedgerows, ponds, and uncultivated field margins provide essential space for pollinators and native species.
What Is Space for Nature?
Space for Nature refers to the share of farmland set aside for natural or semi-natural habitats, like hedgerows, woodlands, ponds, and grasslands. These areas support pollinators, protect soil and water, and create corridors for wildlife. The EU Biodiversity Strategy for 2030 sets a target: 10% of all agricultural land should include these high-diversity features to help restore ecosystems and strengthen sustainability.
-
Share of farmland set aside for natural habitats.
-
Supports biodiversity and ecosystem health.
-
EU demands 10% of farmland dedicated to space for nature.
The EU 2030 Target
The European Union has set a target for having 10% of agricultural land under ‘High diversity landscape Features’ by 2030. This creates a clear standard: a farm with >10% habitat can be considered ‘Biodiverse’, meeting the EU Space for Nature target.
Key Metric: Farms with more than 10% Space for Nature meet EU biodiversity commitments.
The Biodiversity Crisis
- 1 million species threatened with extinction globally
- 47% decline in natural ecosystems relative to the earliest states
- Agriculture is the number 1 driver of biodiversity loss globally
Understanding Land Cover Types
Not all agricultural land contributes equally to biodiversity. Space for Nature distinguishes between managed productive areas and natural habitats that support wildlife. Understanding these classifications is crucial for accurate biodiversity assessment and meeting EU 2030 targets. Features like hedgerows, ponds, and uncultivated field margins provide essential space for pollinators and native species. Measuring and increasing this space helps align farm landscapes with both environmental and regulatory goals.
Real-World Examples: Land Cover Analysis
These real-world scenarios demonstrate how different land cover combinations result in varying Space for Nature percentages. Understanding these patterns helps identify opportunities for biodiversity improvement.
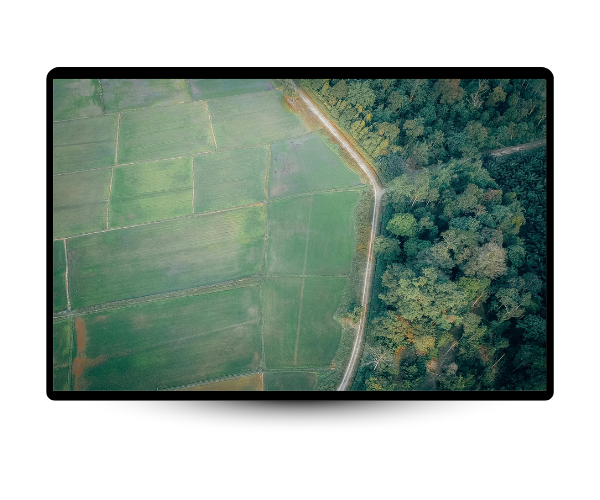
Scenario 1: Intensive Dairy Farm
Result: 0% Space for Nature
This farm fails to meet the EU 2030 target. Grasslands improved with fertilizer and reseeding have very low species richness (1-2 grass species) and support minimal wildlife diversity. Priority for habitat creation initiatives.
Improvement opportunities
Enhance biodiversity without reducing yields by converting unproductive field margins into hedgerows, creating buffer strips along waterways, and establishing wildlife corridors between fields.
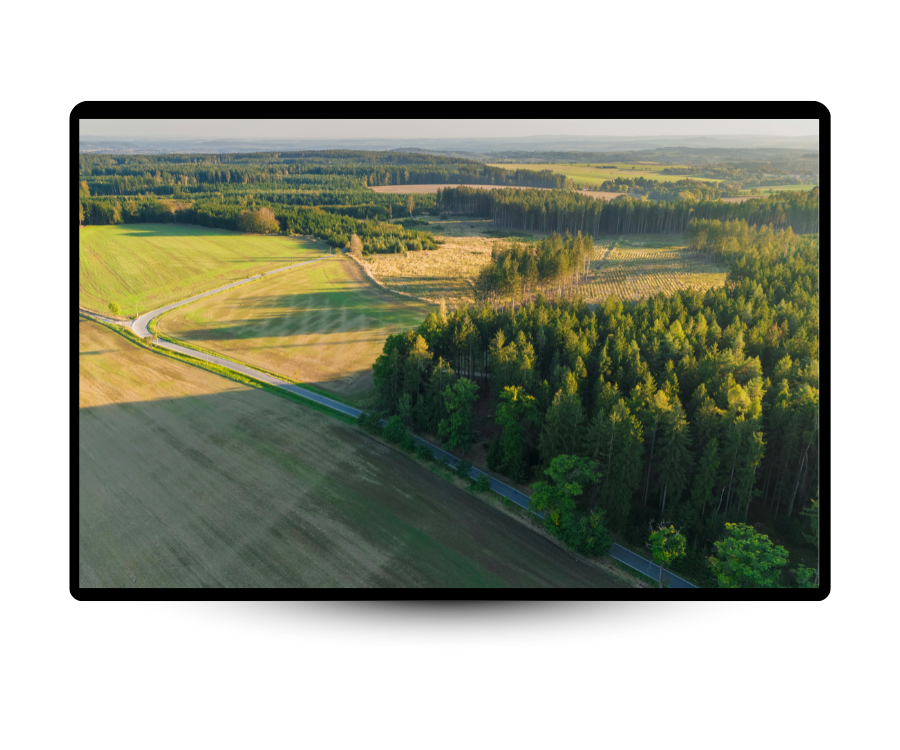
Scenario 2: Mixed Agricultural Landscape
Result: 50% Space for Nature
This landscape significantly exceeds the EU 2030 target (> 10%). The combination of woodland and grassland creates a biodiversity-rich environment supporting diverse wildlife communities and ecosystem services.
Biodiversity value: High connectivity between habitats, diverse food sources, shelter for wildlife movement, and strong ecosystem resilience.
Scenario 3: Habitat Loss Over Time
Year 1: Baseline
50% Space for Nature
Year 5: After Expansion
40% Space for Nature (-10%)
Trend Analysis Insight
While this landscape still maintains high Space for Nature (40%), the declining trend indicates threats to biodiversity. Agricultural expansion reduced the wetland area by 10 percentage points over 5 years. This demonstrates the importance of temporal monitoring in identifying and addressing habitat loss before it becomes critical.
Scenario 1: Intensive Dairy Farm
100% Improved Pasture = 0% Space for Nature
Result: 0% Space for Nature
This farm fails to meet the EU 2030 target. Grasslands improved with fertilizer and reseeding have very low species richness (1-2 grass species) and support minimal wildlife diversity. Priority for habitat creation initiatives.
Improvement opportunities
Enhance biodiversity without reducing yields by converting unproductive field margins into hedgerows, creating buffer strips along waterways, and establishing wildlife corridors between fields.
Scenario 2: Mixed Agricultural Landscape
Result: 50% Space for Nature
This landscape significantly exceeds the EU 2030 target (> 10%). The combination of woodland and grassland creates a biodiversity-rich environment supporting diverse wildlife communities and ecosystem services.
Biodiversity value: High connectivity between habitats, diverse food sources, shelter for wildlife movement, and strong ecosystem resilience.
Scenario 3: Habitat Loss Over Time
Year 1: Baseline
50% Space for Nature
Year 5: After Expansion
40% Space for Nature (-10%)
Trend Analysis Insight
While this landscape still maintains high Space for Nature (40%), the declining trend indicates threats to biodiversity. Agricultural expansion reduced the wetland area by 10 percentage points over 5 years. This demonstrates the importance of temporal monitoring in identifying and addressing habitat loss before it becomes critical.
Regenerative Potential
- Cover crops and diverse rotations
- Agroforestry systems
- Conservation tillage practices
- Integrated pest management
Ecosystem Services
Natural habitats provide critical services beyond biodiversity:
- Carbon sequestration
- Water filtration and retention
- Pollination services
- Natural pest control
Connectivity Matters
Habitat quality depends on spatial arrangement and connectivity:
- Wildlife corridors between patches
- Stepping stone habitats
- Buffer zones around sensitive areas
- Landscape-scale planning
Why Measuring Space for Nature?
The Space for Nature metric functions as a true Key Performance Indicator: it is objective, consistently measurable across sites, and provides ecologically meaningful insights into biodiversity health.
Regulatory Compliance
Meet EU biodiversity regulations and sustainability reporting requirements under CSRD and TNFD frameworks.
Reportable under: CSRD ESRS 4, TNFD C1 Spatial Footprint
Ecological Significance
At > 10% Space for Nature, there’s sufficient shelter and food for species movement and foraging, reducing habitat isolation effects.
Science-based: Threshold supports wildlife dispersal and ecosystem function
Supply Chain Transparency
Objective, satellite-based measurements enable reliable reporting and stakeholder communication about biodiversity performance.
Scalable: Cost-effective assessment across thousands of suppliers
How ODOS Measures Space For Nature
You Provide The Location, We Deliver The Data.
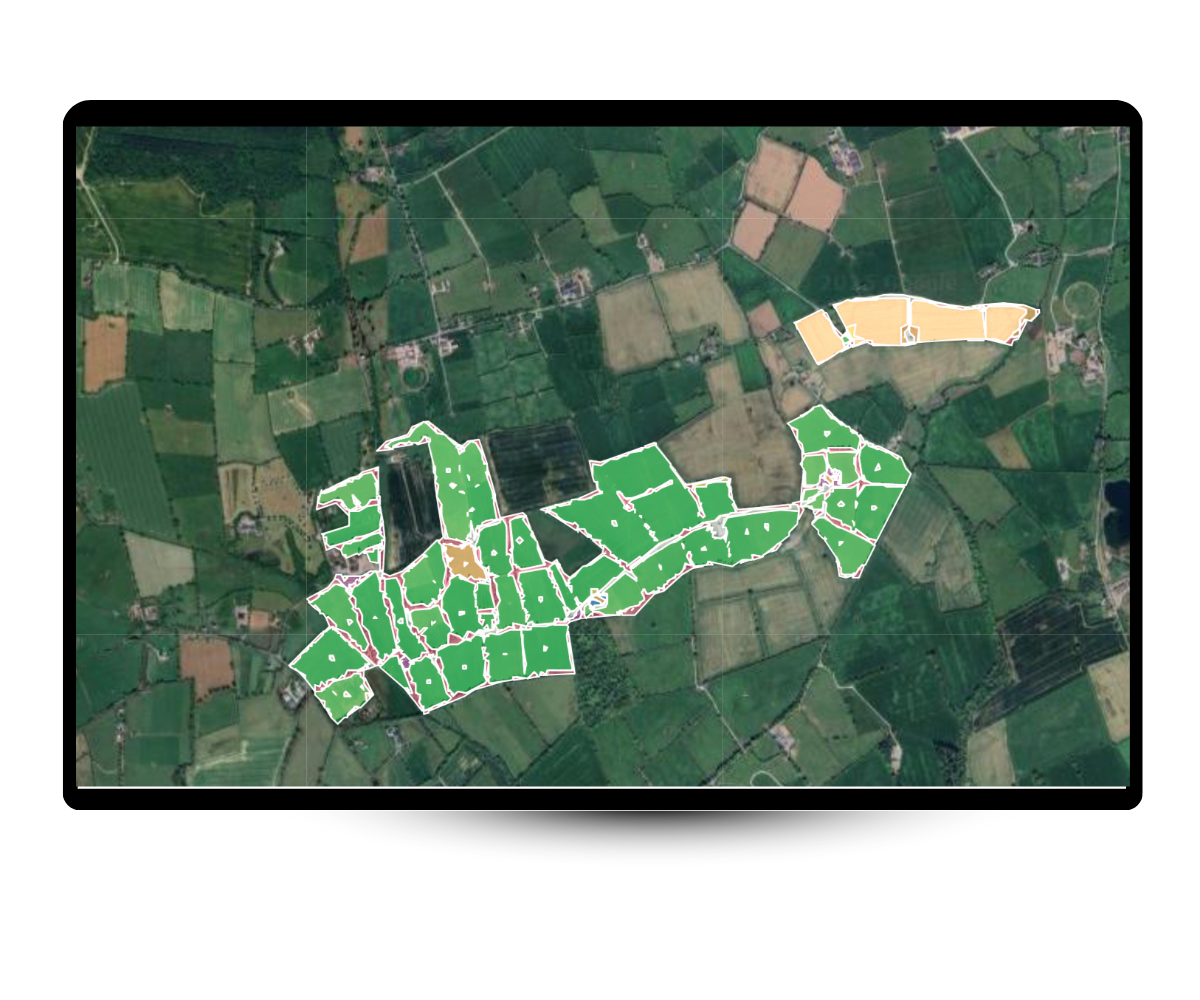
Satellite Imagery
Just tell us where to map. We match your farm boundaries using 50 cm satellite imagery, to extract parcels. This lets us identify key features like fields, forests, hedgerows, water bodies and more in minutes.
AI Land Cover Classification
We use Object-Based Image Analysis (OBIA) and AI to turn satellite images into habitat maps. The system groups pixels into shapes like fields or tree lines, then uses trained models to classify each one, based on 39,000+ real-world examples.
Land Use Scoring Engine
Our Space for Nature metric translates complex habitat data into a simple score: the percentage of natural or semi-natural habitat within the total farm area. This provides a clear measure of compliance with EU 2030 biodiversity targets and allows companies to track progress over time.
Platform Capabilities
- Satellite-powered habitat mapping
- High-resolution optical and radar imagery
- AI models with 92% accuracy
- 10-year historical trend analysis


Satellite Imagery
Just tell us where to map, and we'll extract your farm boundaries + map your farms using 50cm satellite imagery. This lets us identify key features like hedgerows, forests, natural grasslands and shrubs in minutes.
AI Land Cover Classification
We use Object-Based Image Analysis (OBIA) and AI to turn satellite images into habitat maps. The system groups pixels into shapes like fields or tree lines, then uses trained models to classify each one, based on 39,000+ real-world examples.
Land Use Scoring Engine
Our Space for Nature metric translates complex habitat data into a simple score: the percentage of natural or semi-natural habitat within the total farm area. This provides a clear measure of compliance with EU 2030 biodiversity targets and allows companies to track progress over time.
Platform Capabilities
- Satellite-powered habitat mapping
- High-resolution optical and radar imagery
- AI models with 92% accuracy
- 10-year historical trend analysis
Frequently Asked Questions
Common questions about measuring Space for Nature in agricultural supply chains.
The EU Biodiversity Strategy for 2030 sets a target of having at least 10% of agricultural area under high-diversity landscape features. This creates an objective standard: a farm with >10% habitat can be considered ‘Biodiverse’, meeting the EU Space for Nature target.
Our AI models achieve 92% F1 accuracy for 5 landcover classes and 86% F1 accuracy for 20 detailed landcover classes. This has been validated through ground-truthing studies and farmer verification.
Yes, our technology scales efficiently. A typical 60ha farm is mapped in minutes. We use automated boundary extraction from LPIS data and can process thousands of farms, making large-scale supply chain assessment cost-effective.
Space for Nature measures quantity, the percentage of land area dedicated to biodiversity habitats. Habitat quality measures how suitable an area is for wildlife, considering factors such as connectivity, shape, and spatial configuration. ODOS provides both metrics for a comprehensive biodiversity assessment.
Our Space for Nature measurements directly support CSRD ESRS 4 (Habitat Amount) and TNFD C1 (Total Spatial Footprint) reporting requirements. The objective, satellite-based methodology provides verifiable data for regulatory compliance and stakeholder reporting
Yes, we maintain a 10-year satellite archive enabling historical analysis and trend monitoring. This allows you to track habitat loss or gain over time, measure conservation success, and identify emerging threats to biodiversity in your supply chain.
Learn More About Biodiversity
Dive deeper into biodiversity measurement, conservation strategies, and sustainability reporting with our blog posts related to biodiversity.
Boost Sustainability with Biodiversity in Your Supply Chain
Biodiversity in Agriculture: Why It Matters and How to Measure It?
Biodiversity Footprinting in Vineyards: Methods and Benefits
Ready To Act On Space For Nature?
Book a meeting with our biodiversity specialist to explore how Space for Nature can work for your supply chain.