-
Habitat Quality
Measuring Biodiversity Through
Habitat Quality
Transform satellite imagery into actionable biodiversity insights. Understand not just how much nature exists, but how well it functions for species survival and ecosystem health.
Measuring Biodiversity Through Habitat Quality
Transform satellite imagery into actionable biodiversity insights. Understand not just how much nature exists, but how well it functions for species survival and ecosystem health.
Understanding Habitat Quality
Habitat quality goes beyond simply measuring how much nature exists on a landscape. It evaluates how well that nature functions for species survival, movement, and ecosystem health.
- Habitat Quantity
Space for Nature Metric
Measures the percentage of land under natural habitats. Example: “This farm has 25% woodland coverage.”
- Habitat Quality
Ecosystem Function Metric
Evaluates how functional those habitats are for biodiversity. Example: “This 25% woodland is well-connected with high species movement potential.”
Key Quality Factors
-
Shape & Size Matter
Larger, more circular habitats provide better core areas protected from edge effects. A 10-hectare circular woodland supports more species than a thin 10-hectare strip.
-
Connectivity is Critical
Connected habitats allow species movement, gene flow, and reduce isolation effects. Corridors and stepping stones between patches are essential for ecosystem function.
-
Linear Features Count
Hedgerows, tree lines, and field margins act as bridges between habitat patches, providing movement corridors and additional habitat area.
-
Habitat Type Diversity
Different habitat types (woodland, grassland, wetland) support different species. A mosaic of habitat types creates higher overall biodiversity value.
Quality Assessment Example
Why Measure Habitat Quality?
Measuring Habitat Quality goes beyond simply knowing how much land is set aside for nature. It asks a deeper question: are these habitats actually useful for species survival and movement?
Connectivity
Allowing species to move across landscapes rather than being trapped in isolated fragments.
Functionality
Providing food, shelter, and safe corridors for biodiversity.
Resilient
Better able to withstand pressures such as climate change and intensive agriculture.
- Connected Landscape
Well connected patches
Species can move freely between habitat patches.
- Poor Connected Landscape
Poor connected patches
Isolated patches limit species movements and survival.
-
The Risk of Measuring Quantity Alone
Without measuring quality, companies risk overlooking isolated or degraded habitats that contribute little to biodiversity outcomes. A farm may technically meet habitat area targets, but if those habitats are fragmented or poor in structure, their ecological value is limited.
-
25% habitat coverage but isolated patches
-
15% habitat coverage but well-connected
-
25% habitat coverage but isolated patches
-
15% habitat coverage but well-connected
Compliance & Regulatory Requirements
From a compliance perspective, Habitat Quality is increasingly part of global sustainability standards:
-
 Corporate Sustainability Reporting Directive
ESRS 4 - Biodiversity and Ecosystems
Companies must report on changes in spatial configuration and ecosystem connectivity.
-
 Task Force on Nature-related Financial Disclosures
Category 5 - State of Nature
Habitat Quality is recognized as a critical state of nature indicator.
Measuring Quality Helps Companies:
Indentify & Act
Identify weak points in their landscapes and take action to restore or connect habitats.
Communicate Credibility
Communicate more credible and transparent results to regulators, investors, and consumers.
Strengthen Brand Reputation
Consumer awareness of environmental issues makes habitat quality a critical component of brand reputation and market access.
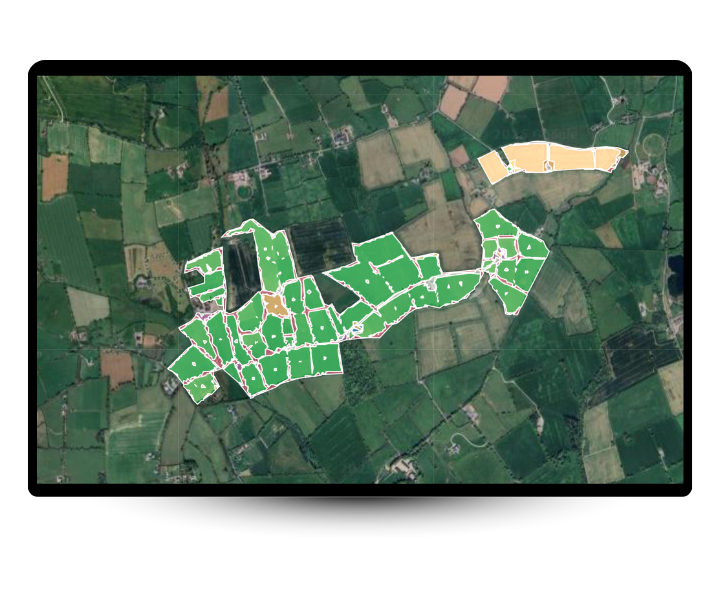
How ODOS Measures Habitat Quality
You Provide The Location, We Deliver The Data.
ODOS transforms satellite imagery through a systematic process, identifying habitats, analyzing their quality, and providing specific recommendations for improvement.
1. Habitat Identification
AI analysis identifies and maps different habitat types from satellite imagery
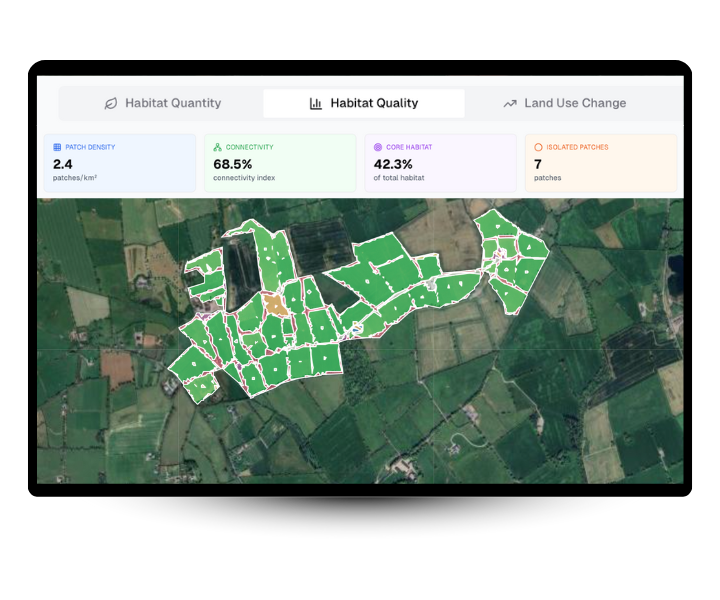
2. Quality Assessment
Each habitat receives quality scores based on connectivity and functionality
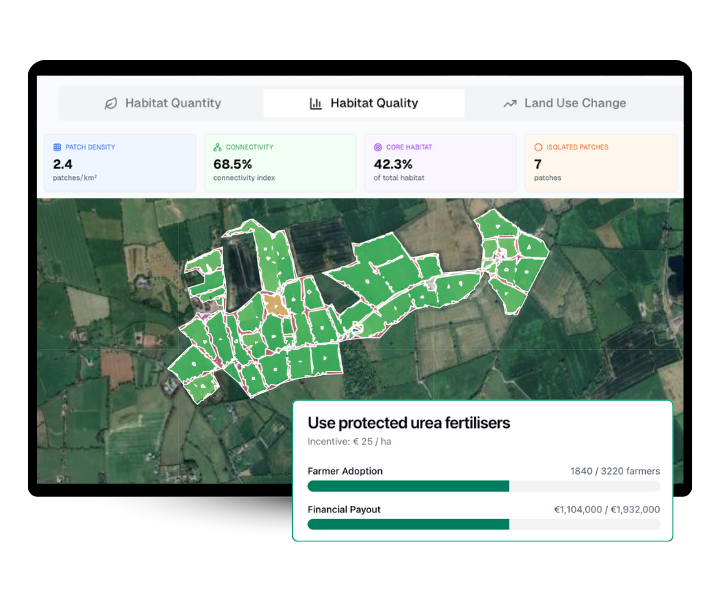
3. Improvement Plan
Specific recommendations to enhance habitat quality and biodiversity
Our Condition Tool
Habitat Patches
Habitat Type
Weighted
Area
Measured
Degree of Core
Calculated
Shape Index
Geometric
Connectivity
Network.
Linear Features
Connector Type
Bridge/Branch
Area
Length x Width
Width
Measured
Distance to Patch
Proximity
Frequently Asked Questions
Common questions about measuring Habitat Quality in agricultural supply chains.
Habitat quantity measures the percentage of land that is naturally occurring (e.g., 20% woodland). Habitat quality evaluates how functional that habitat is. A fragmented 20% woodland with poor connectivity scores lower than a well-connected 20% woodland with good shape and corridors.
We recommend annual assessments to track changes and improvements. For regulatory reporting under CSRD and TNFD, annual measurement provides the temporal data needed to demonstrate progress toward biodiversity targets.
Our AI models achieve 86-92% accuracy using multiple satellite systems (Sentinel, SPOT, Pleiades, Dove). We validate results through ground-truthing with farmers and use established methodologies from the European Joint Research Council.
Our habitat quality metrics directly support CSRD ESRS 4 requirements for “Changes in Ecosystem Structural Connectivity” and TNFD Category 5 metrics for “Ecosystem Connectivity” and “Habitat Quality”. Reports are compliance-ready for regulatory submission.
Absolutely. Our scoring system identifies specific improvement opportunities: connecting isolated patches, enhancing linear features like hedgerows, improving habitat shape, and increasing core areas. Each recommendation is prioritized by potential biodiversity impact.
Yes, we maintain a 10-year satellite archive enabling historical analysis and trend monitoring. This allows you to track habitat loss or gain over time, measure conservation success, and identify emerging threats to biodiversity in your supply chain.
Learn More About Biodiversity
Dive deeper into biodiversity measurement, conservation strategies, and sustainability reporting with our blog posts related to biodiversity.
Boost Sustainability with Biodiversity in Your Supply Chain
Biodiversity in Agriculture: Why It Matters and How to Measure It?
Biodiversity Footprinting in Vineyards: Methods and Benefits
Ready To Act On Habitat Quality?
Book a meeting with our biodiversity specialist to explore how habitat quality can work for your supply chain.