Tell Us Where Your Vineyard Is
And View Future Production Risk
How will rising temperatures affect your vineyards from 2025 to 2050? Our climate risk graph provides temperature projections tailored to your production area using climate scenario analysis.
Tell Us Where Your Vineyard Is
And View Future Production Risks
How will rising temperatures affect your vineyards from 2025 to 2050? Our climate risk graph provides temperature projections tailored to your production area using climate scenario analysis.
1. Drop a Pin
2. Check Your Inbox
3. Expand The View
Understand your site’s future temperatures
×Thank you — you’ll receive your temperature results by email shortly.
What You’ll Receive in Your Inbox
You Provide The Location, We Deliver The Data.
A Satellite View of Your Vineyard
Just tell us where to map, and we'll extract your vineyard location using 50cm satellite imagery. This allows us to generate climate risk projections specific to that area.
Production Risks Over Time
Compare moderate and extreme climate scenarios to see how temperature, drought, and disease risk may evolve at your vineyard site over time.
Data To Act On
Use your vineyard’s climate forecast to plan for varietal shifts, irrigation needs, and site adaptation. When heat accumulation rises too high, grape production and quality can decline significantly.
Preview of Possible Results:
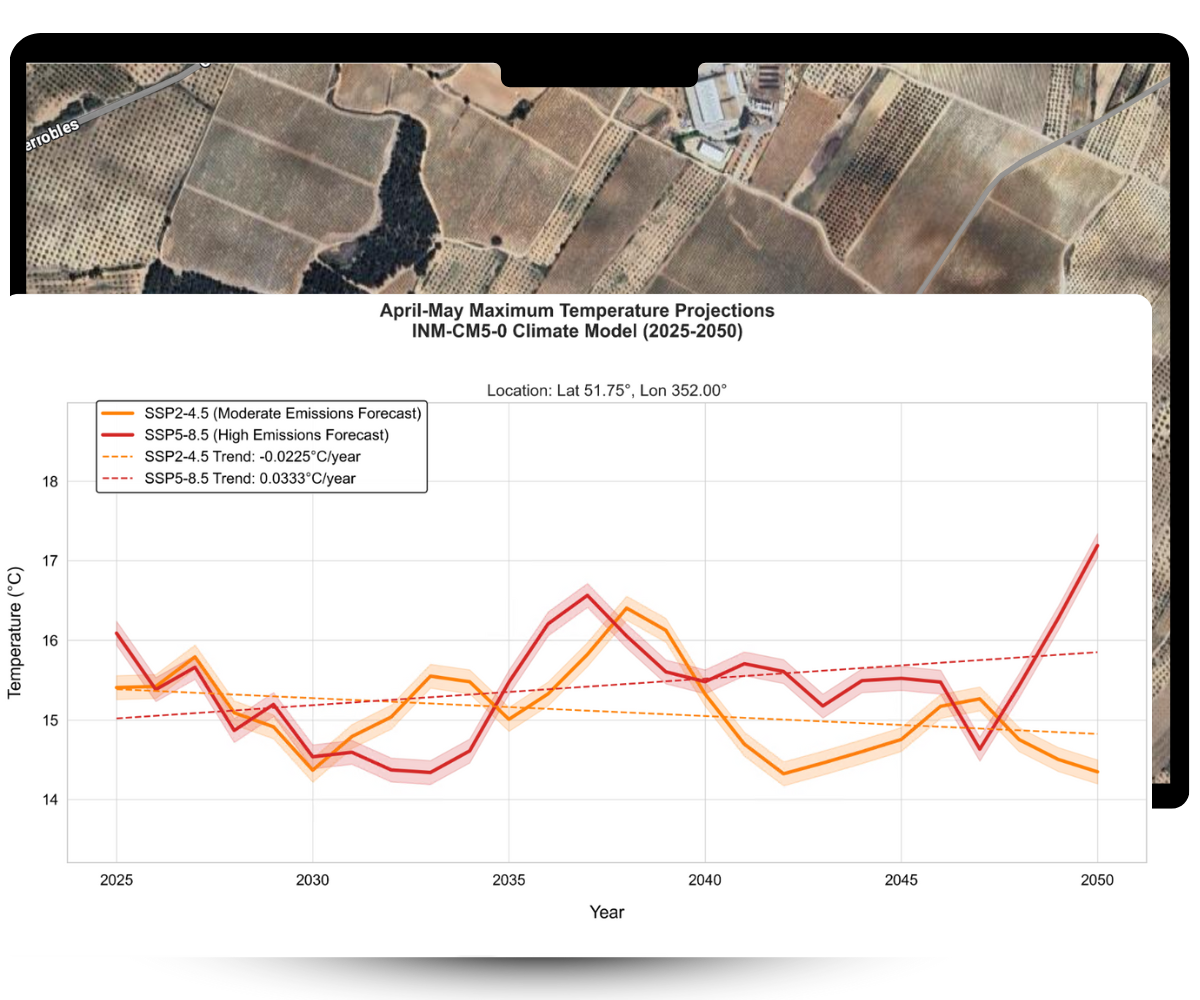
ODOS has conducted an climate forecast based on your location:
- Climate Scenario Period: 2025–2050 (April-May)
- Maximum Temperature (April–May, 2040): ~16.4 °C
- Projected Temperature Moderate Emissions (2050, SSP2-4.5): ~14.5 °C
- Projected Temperature High Emissions (2050, SSP5-8.5): ~17.3°C
- SSP2-4.5 Trend: –0.0225 °C per year (moderate emissions)
- SSP5-8.5 Trend: –0.333 °C per year (high emissions)
What You’ll Receive in Your Inbox
You Provide The Location, We Deliver The Data.
A Satellite View of Your Vineyard
Just tell us where to map, and we'll extract your vineyard location using 50cm satellite imagery. This allows us to generate climate risk projections specific to that area.
Production Risks Over Time
Compare moderate and extreme climate scenarios to see how temperature, drought, and disease risk may evolve at your vineyard site over time.
Data To Act On
Use your vineyard’s climate forecast to plan for varietal shifts, irrigation needs, and site adaptation. When heat accumulation rises too high, grape production and quality can decline significantly.
Preview of Possible Results:
ODOS has conducted an climate forecast based on your location:
-
Climate Risk Intelligence
Why This Data Matters to Winegrowers
From Grape Quality to Strategic Planning. Know What’s Coming
Vineyard Relocation Planning
If your current vineyard exceeds heat thresholds, grape performance drops, making it important to assess other potential locations.
Irrigation and Water Stress
Declining rainfall and rising drought risk make water planning critical for long-term vineyard resilience.
Rethink Varietal Choices
Warmer climates may challenge your current grape varieties, making data essential for future planting decisions.
-
Remote Sensing Intelligence
Understanding Climate Scenario Models
Discover how temperature build-up shapes grape ripening and vineyard performance.
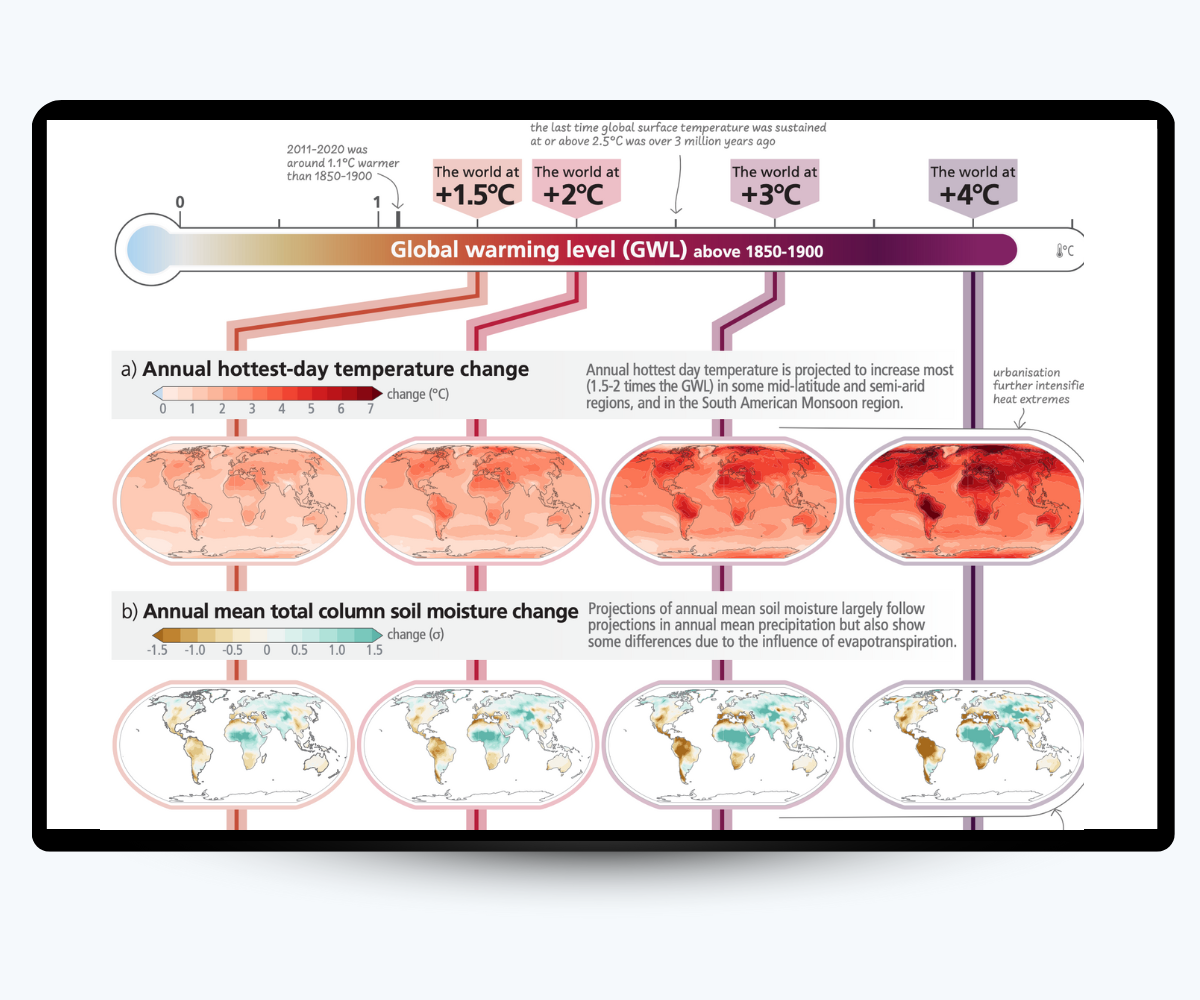
Figure 1: The Intergovernmental Panel on Climate Change
What Is Heat Accumulation?
Heat accumulation refers to the total warmth a vineyard experiences during the growing season. It’s not just about daily temperatures, but how much heat builds up over time. This is especially important during flowering, when grapevines begin forming fruit. In Europe, flowering usually happens in late spring (April to June).
When heat levels exceed a variety’s ideal range, such as seasonal averages over 21 °C or frequent days above 35 °C, grape yield and quality can decline significantly.
What Are SSPs?
Shared Socioeconomic Pathways (SSPs) are future scenario models developed by the Intergovernmental Panel on Climate Change (IPCC). They combine projections of greenhouse gas emissions with assumptions about how the world might evolve in terms of population, economic growth, energy use, land use, and policy action.
Difference between SSP4.5 and SSP8.5
SSP4.5
Represents a “moderate emissions” scenario. It assumes some global climate action, like decarbonization, policy changes, and improved energy efficiency, resulting in slower warming.
SSP8.5
Reflects a “high emissions” or “worst-case” scenario, where fossil fuel use remains high, climate policy is minimal, and warming accelerates significantly.
How These Models Work
At ODOS, we use climate scenario models aligned with IPCC SSPs to project future changes in temperature and heat accumulation. These projections allow us to assess how warming could impact wine production, from grape ripening and acidity to varietal suitability and long-term yield.
Your personalized graph uses these SSP scenarios to show how your vineyard’s climate zone could evolve by 2025–2050, helping you plan smarter for the future.
Frequently Asked Questions
Rising temperatures, extreme weather, and shifting rainfall patterns can disrupt grape ripening, lower acidity, reduce yields, and change the suitability of existing grape varieties.
When heat levels exceed a variety’s ideal range, such as seasonal averages over 21 °C or frequent days above 35 °C, grape yield and quality can decline significantly.
It’s a detailed projection of how climate variables, like temperature and drought, are expected to evolve at your vineyard location, helping you adapt your viticulture strategy.
April–May is the critical flowering season. Extreme heat or irregular temperatures during this phase can negatively impact fruit set, grape quality, and overall harvest.
These are future climate pathways defined by the Intergovernmental Panel on Climate Change (IPCC). SSP2-4.5 assumes moderate emissions reductions, while SSP5-8.5 reflects a high-emissions, high-warming scenario with minimal policy action.
You’ll receive a satellite image of your vineyard area and a 2025–2050 climate projection graph showing how temperature may change under both emission scenarios.
It supports better planning for varietal selection, vineyard investments, irrigation needs, and long-term adaptation, reducing climate risk and protecting future yields.
Yes. ODOS can scale assessments across entire supply chains + giving more detailed predictions to help producers, cooperatives, or ESG teams evaluate and manage risk across multiple vineyard locations.
Yes. ODOS uses IPPC-aligned (Intergovernmental Panel on Climate Change) scenarios and global climate models like KIOST-ESM to deliver science-backed, location-specific forecasts for agriculture and viticulture.
Ready to measure your vineyards climate forecast?
Talk to our biodiversity and remote sensing experts today.