Submit details
Answer 7 questions about a farm in your supply-chain

Step 02
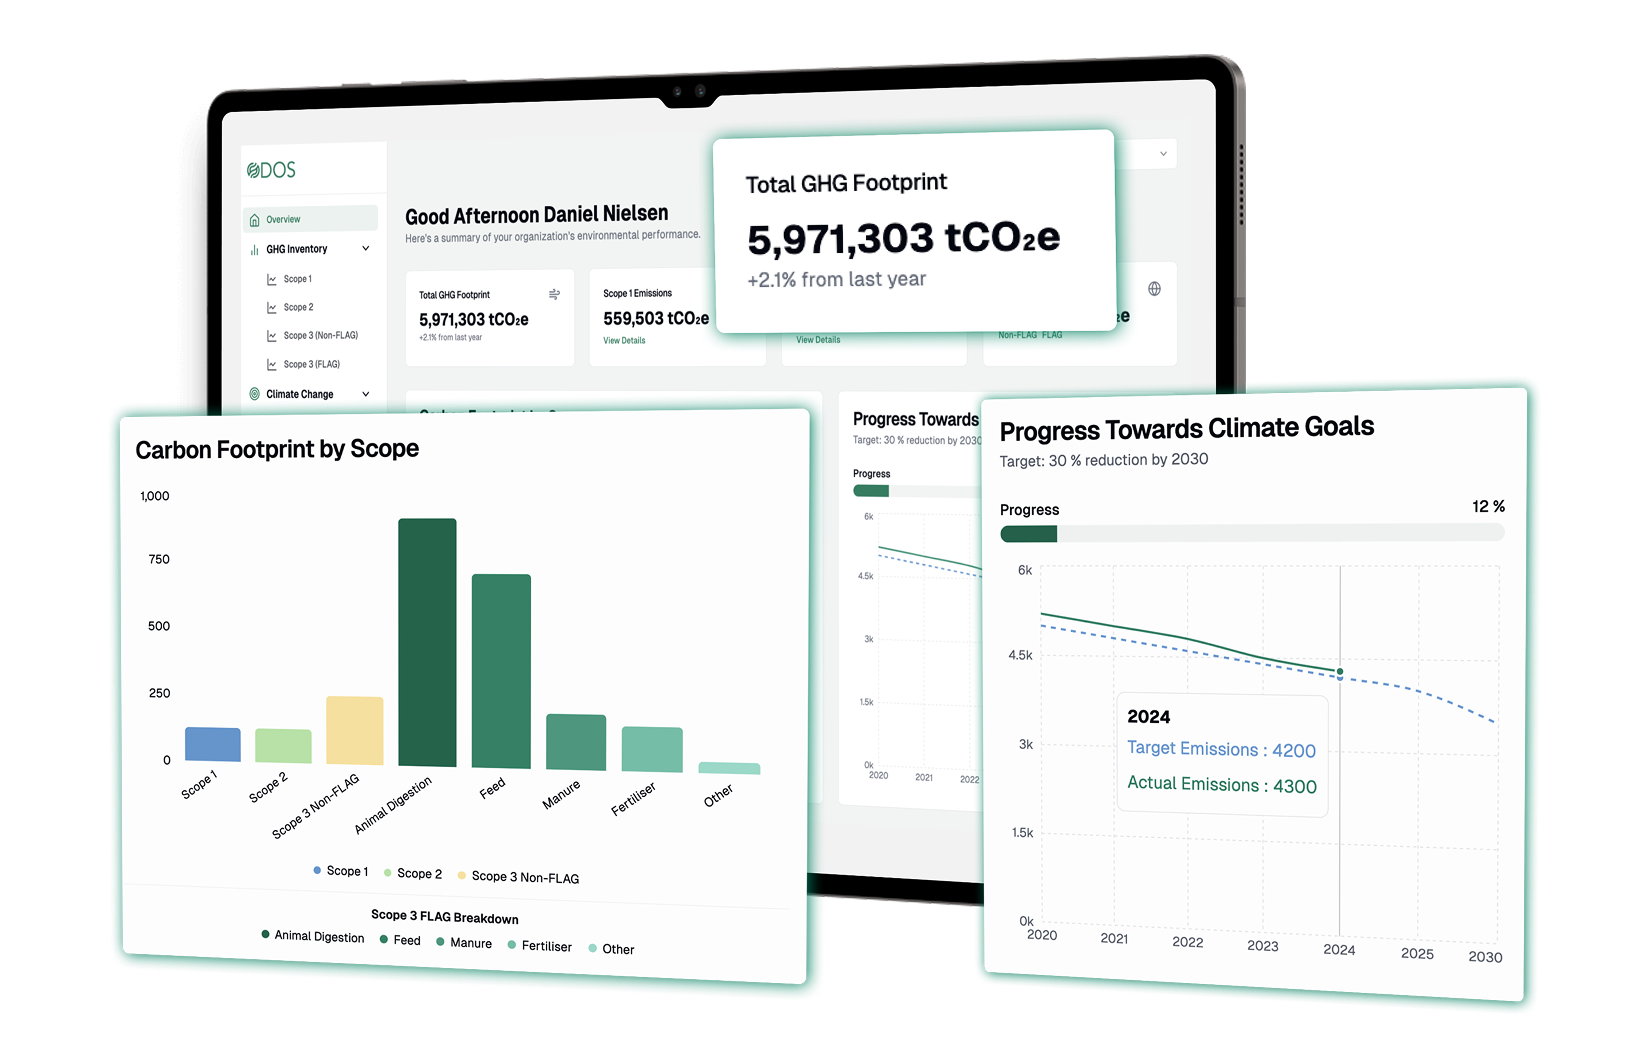
We run the numbers
Using our science-based LCA models, we run the calculations in the background
Step 02


Rubén Hidalgo
"ODOS enabled us to understand exactly what is happening on our farms. With their customized solutions for emissions and biodiversity analysis, they not only found hidden potential but also showed us how to unlock it. Thanks to the strategy developed by ODOS, we are a huge step closer to reaching our sustainability goals.”