Land Intelligence Assessment in Agriculture
Learn how to measure biodiversity in agriculture using indicators like habitat connectivity, Natura 2000 overlap, and land-use intensity. See how ODOS helps farmers track them at scale.
-
Remote Sensing Intelligence
Understanding Land Use Change
Discover how satellite technology transforms agricultural sustainability measurement.
What Is Land Use Change
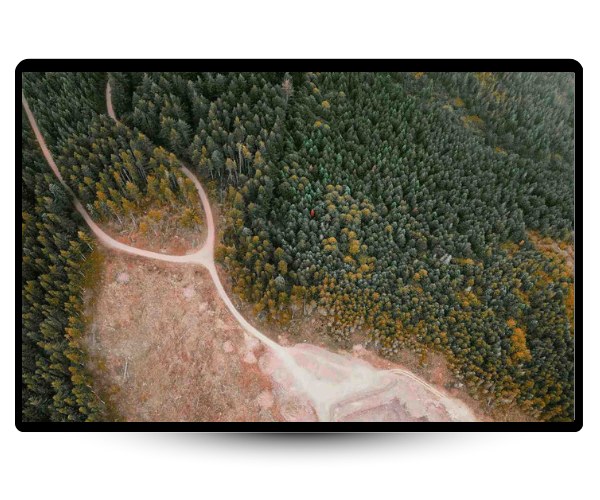
Land use change in agriculture means altering natural land to make space for farming. Turning forests, grasslands, or wetlands into fields or pastures affects wildlife, reduces carbon storage, and changes how ecosystems work.
-
Forests and grasslands turned into farmland.
-
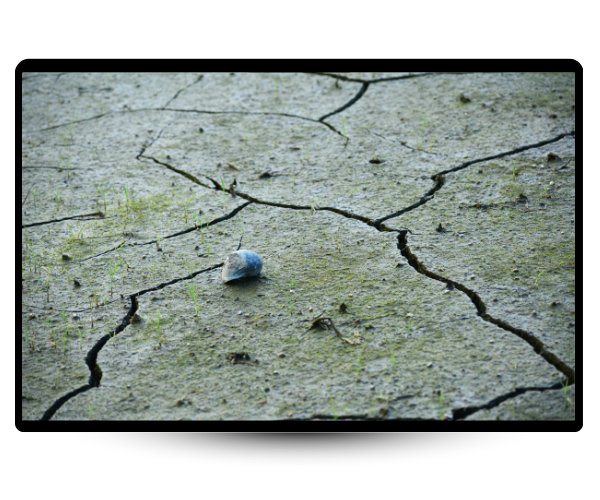
Expanding fields and pastures affect local nature.
-
Farm infrastructure and irrigation break up natural habitats.
Why It Matters for Agri-Food
In agriculture, nature is the backbone of productivity: pollination, soil health, water cycles, and climate resilience all depend on healthy ecosystems. Yet biodiversity has dropped by 70% since 1970, largely due to land use change. Agriculture now covers 40% of global land. By 2030, the EU requires 10% of farmland to be set aside as “Space for Nature.”
-
Biodiversity has dropped by 70% since 1970
-
Nature as backbone of farm productivity
-
EU demands farmland natural zones
-
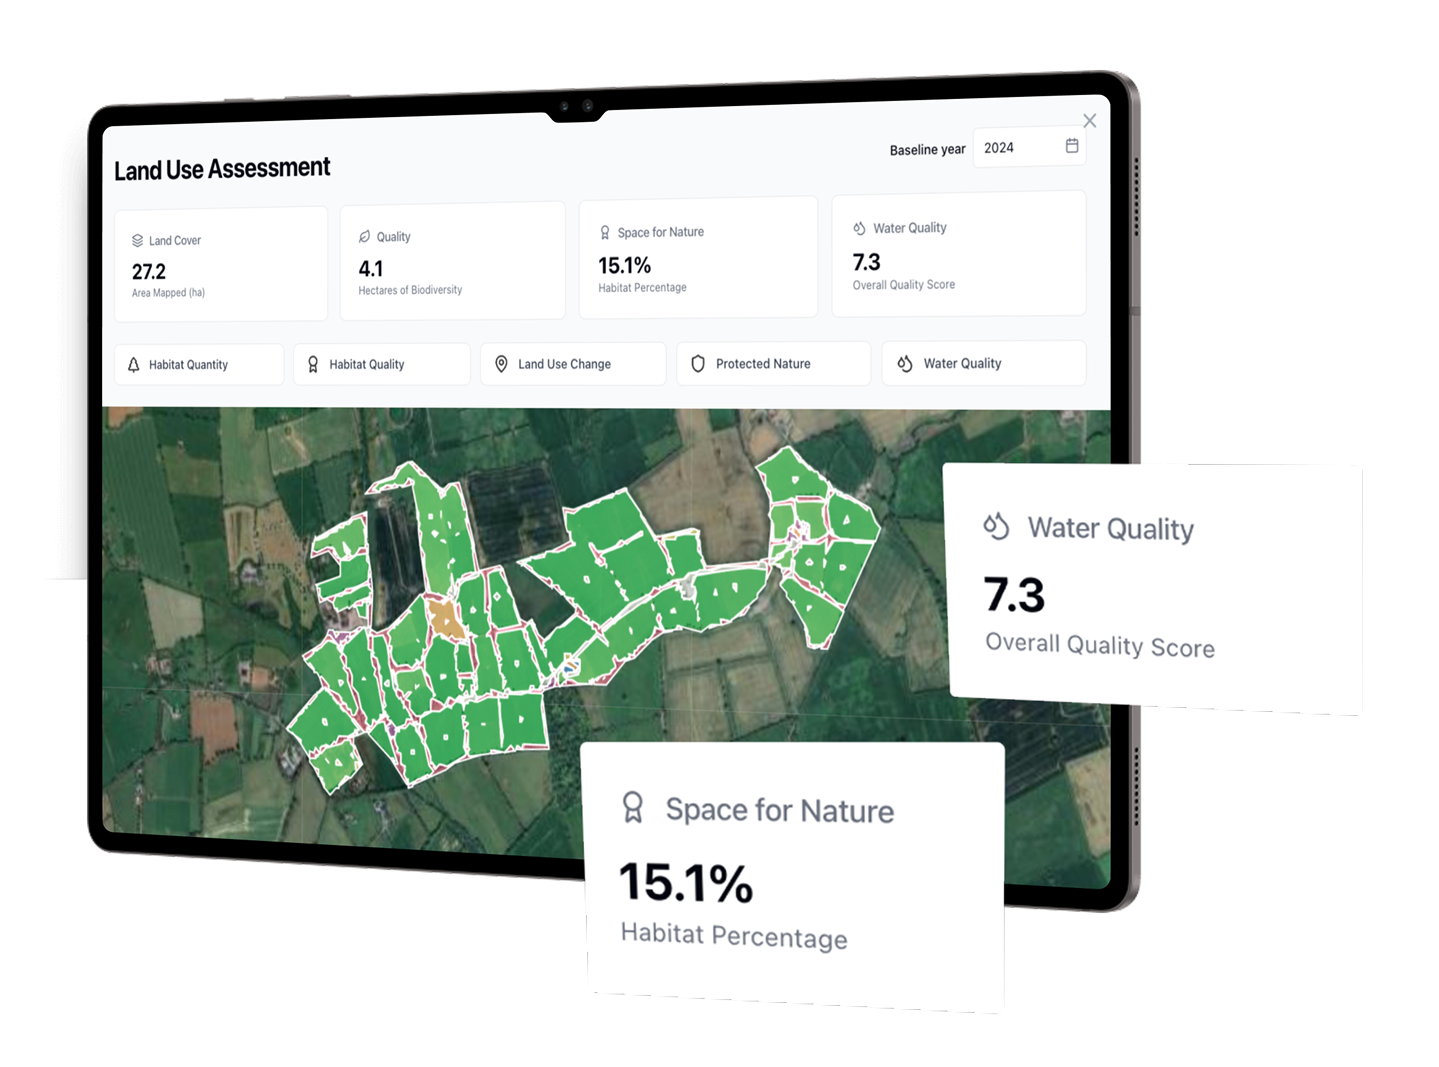
4 Metrics to Define Land Performance
How We Measure
Land Use Performance
The EU has set clear indicators to help farmers and agri-food businesses understand their impact on nature. At ODOS, we focus on four key metrics.
Space for Nature
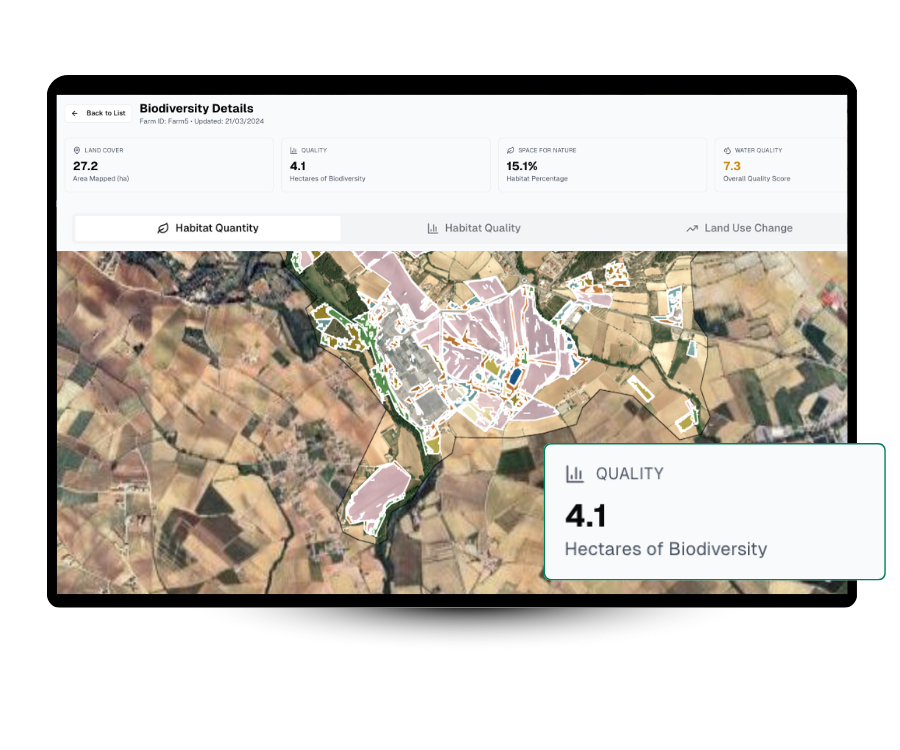
We measure your habitat quantity by mapping how much farmland is managed as natural or semi-natural areas, aligned with the EU’s 10% target.
Habitat Quality & Connectivity
Understand your habitat quality by assessing how suitable and connected landscapes are for supporting species and ecosystems.
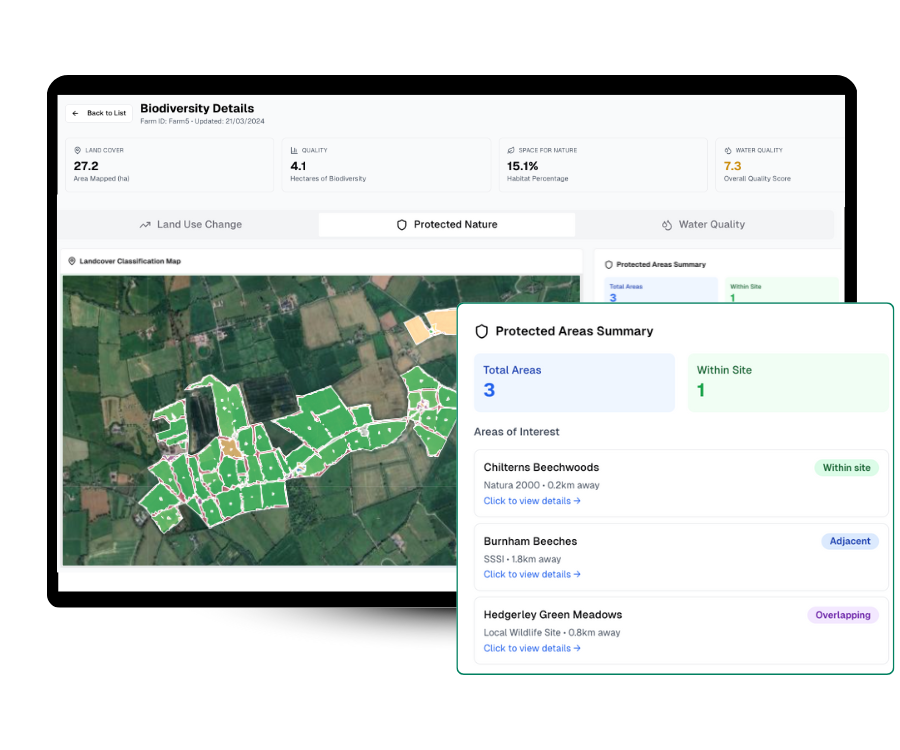
Natura 2000 Overlap
Access your exposure to Natura 2000 areas and red-listed species to align supply chains with EU conservation rules.
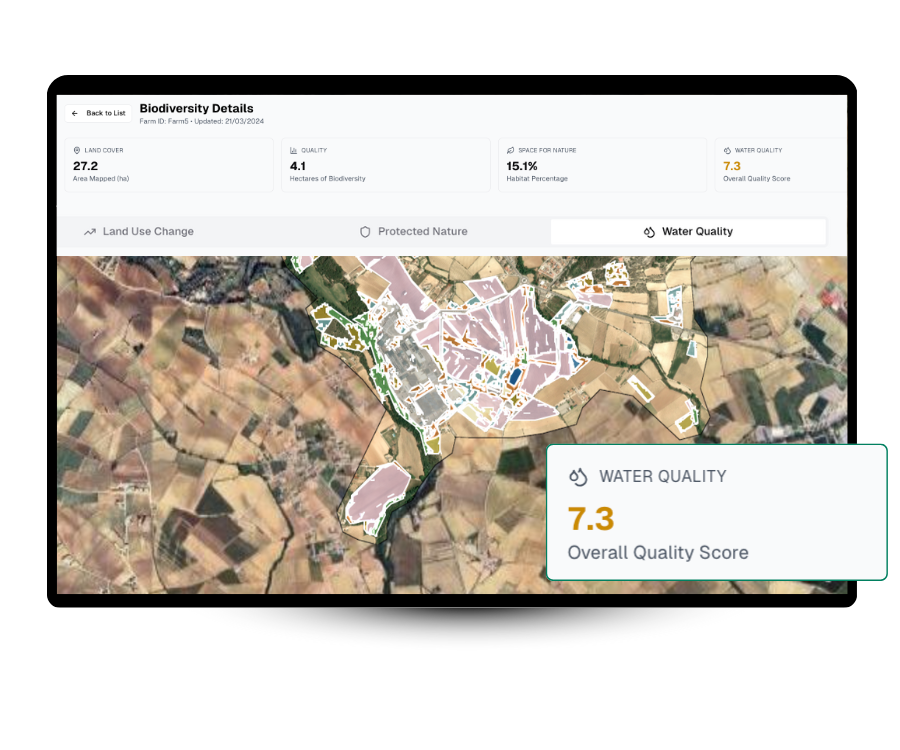
Water Quality & Flow Paths
Understand water risks by mapping nutrient runoff and flow paths to reduce pollution and protect aquatic biodiversity.
-
Four Metrics to Define Land Performance
How We Measure
Land Use Performance
The EU has set clear indicators to help farmers and agri-food businesses understand their impact on nature. At ODOS, we focus on four key metrics.
Space for Nature
We measure your habitat quantity by mapping how much farmland is managed as natural or semi-natural areas, aligned with the EU’s 10% target.
Habitat Quality & Connectivity
Understand your habitat quality by assessing how suitable and connected landscapes are for supporting species and ecosystems.
Natura 2000 Overlap
Access your exposure to Natura 2000 areas and red-listed species to align supply chains with EU conservation rules.
Water Quality & Flow Paths
Understand water risks by mapping nutrient runoff and flow paths to reduce pollution and protect aquatic biodiversity.
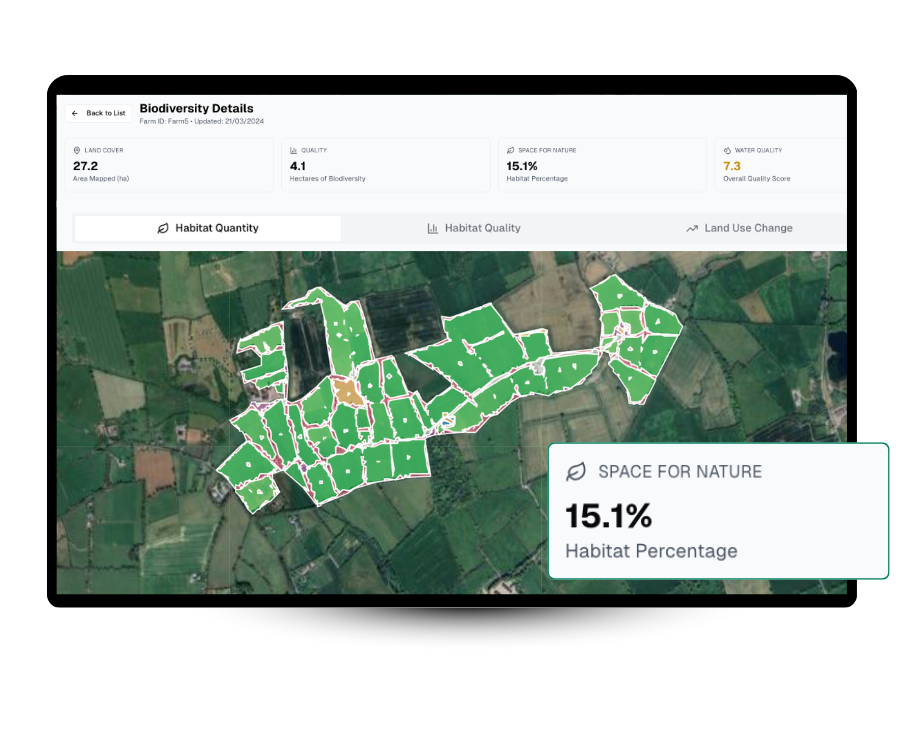
Our Technology
You Provide The Location, We Deliver The Data.
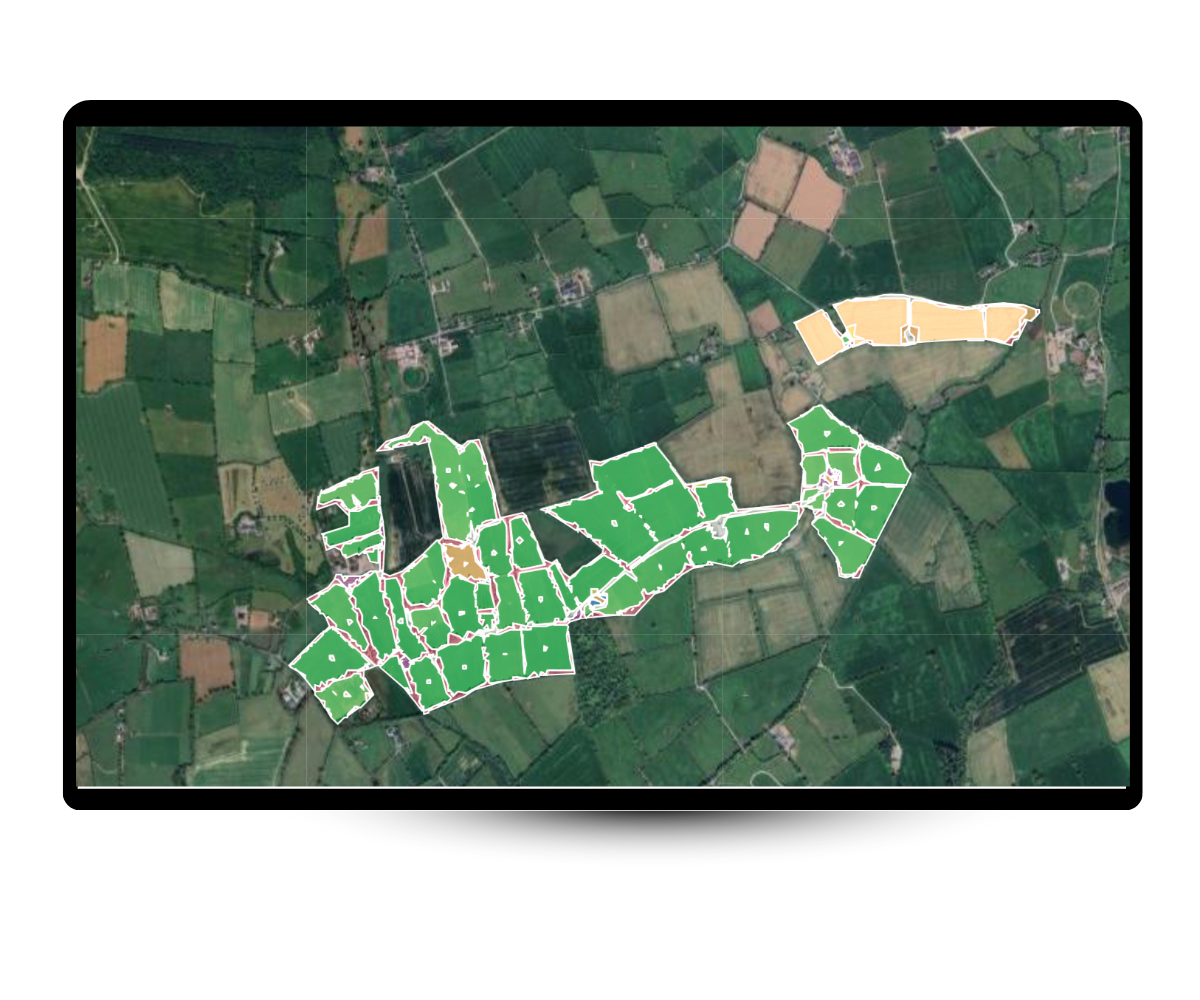
Satellite Imagery
Just tell us where to map, and we'll extract your farm boundaries + map your farms using 50cm satellite imagery. This lets us identify key features like hedgerows, forests, natural grasslands and shrubs in minutes.
AI Land Cover Classification
We use Object-Based Image Analysis (OBIA) and AI to turn satellite images into habitat maps. The system groups pixels into shapes like fields or tree lines, then uses trained models to classify each one, based on 39,000+ real-world examples.
Land Use Scoring Engine
We turn habitat maps into clear performance scores, like Space for Nature, habitat quality, Natura 2000, and water risk. These align with EU and global frameworks, and we adjust for regenerative practices using satellite-based detection.
Platform Capabilities
- Real-time biodiversity monitoring
- Automated species identification
- Habitat quality assessment
- Climate risk analysis and forecasting
- Compliance reporting tools
- Custom dashboard creation


Our Technology
You Provide The Location,
We Deliver The Data.
Satellite Imagery
Just tell us where to map, and we'll extract your farm boundaries + map your farms using 50cm satellite imagery. This lets us identify key features like hedgerows, forests, natural grasslands and shrubs in minutes.
AI Land Cover Classification
We use Object-Based Image Analysis (OBIA) and AI to turn satellite images into habitat maps. The system groups pixels into shapes like fields or tree lines, then uses trained models to classify each one, based on 39,000+ real-world examples.
Land Use Scoring Engine
We turn habitat maps into clear performance scores, like Space for Nature, habitat quality, Natura 2000, and water risk. These align with EU and global frameworks, and we adjust for regenerative practices using satellite-based detection.
Platform Capabilities
- Real-time biodiversity monitoring
- Automated species identification
- Habitat quality assessment
- Climate risk analysis and forecasting
- Compliance reporting tools
- Custom dashboard creation


Frequently Asked Questions
Land Intelligence refers to using satellite imagery, AI, and geospatial analysis to monitor and assess agricultural land for sustainability metrics like biodiversity, deforestation, and land use change. It enables companies to meet regulatory demands (e.g., CSRD, EUDR), improve supply chain transparency, and identify on-farm opportunities for carbon and biodiversity gains.
ODOS applies machine learning models and high-resolution satellite imagery to map over 20 landcover types and identify habitats that qualify as “Space for Nature.” Farms with >10% habitat are considered biodiverse under the EU 2030 Biodiversity Strategy. This biodiversity KPI is objective, repeatable, and reportable.
“Space for Nature” measures the percentage of a farm covered by biodiversity-rich habitats like woodlands, hedgerows, wetlands, and grasslands. It’s directly aligned with EU biodiversity targets and is reportable under CSRD (ESRS 4), TNFD (Nature-Related Disclosures), and the Science-Based Targets for Nature framework.
Yes. ODOS tracks land use change and deforestation across supply chains using a 10-year satellite archive and can assess supplier locations against deforestation-free criteria. This is critical for agri-food companies sourcing soy, beef, or dairy linked to forest-risk commodities.
ODOS Land Intelligence assesses land cover change and ecosystem extent across suppliers to support Scope 3 FLAG (Forest, Land, and Agriculture) emissions accounting. It provides spatially accurate GHG baselines and integrates with MRV platforms for CSRD-ready reporting.
ODOS leverages multiple satellite constellations (Sentinel, SPOT, Pleiades, Dove) with resolutions ranging from 10m to 0.5m and revisit frequencies from annual to daily. This ensures the most accurate, up-to-date habitat mapping and land change monitoring possible.
A new farm can be assessed and mapped for biodiversity within 30 minutes using only an Eircode or farm coordinates. The resulting insights include habitat maps, Space for Nature percentage, and overlays with water quality and Natura 2000, ideal for farm advisors and CSRD reporting.
ODOS is uniquely built on Trinity College Dublin’s AI research and integrates habitat quantity (extent), quality (condition), and regulatory context (Natura 2000, red-listed species) into one actionable platform. It empowers companies to map biodiversity, track land use change, and verify insetting efforts across thousands of farms with precision and speed.
Ready to measure land use change in your supply-chain?
Talk to our biodiversity and remote sensing experts today.